I have a curiosity to know that how we use breakpoints for javascript in asp.net or debug a particular javascript. Few days back, I solve this problem and I want to share this with all of you.
Configure IE to enable script debugging
First of fall we have to make certain settings in which are given below:
Open your Internet Explorer and go to Tools > Internet options > Advance tab and in "Advance Tab" make sure that "Disable script debugging (Internet Explorer)" and "Disable script debugging (other)" both checkboxes are unchecked.
Now you are ready to debug your script, I will show you this by using an example in which I create a Google map with marker.
Default.aspx
<%@ Page Language="C#" AutoEventWireup="true" CodeFile="Default.aspx.cs" Inherits="_Default" %>
<!DOCTYPE html PUBLIC "-//W3C//DTD XHTML 1.0 Transitional//EN" "http://www.w3.org/TR/xhtml1/DTD/xhtml1-transitional.dtd">
<html xmlns="http://www.w3.org/1999/xhtml">
<head id="Head1" runat="server">
<title>Default Map</title>
<script
src="http://maps.google.com/maps?file=api&v=2&key=ABQIAAAAzzZziWgipvlrJKbG_y1t_RRtDDpfVZbOfyV8CEj3g67I7c36_RSz9kcDtHYdiZnyGrD-2fmH2VGylQ"
type="text/javascript"></script>
<script type="text/javascript">
function load() {
debugger; //Use debugger keyword to debug your script in visual studio 2005
if (GBrowserIsCompatible()) {
var map = new GMap2(document.getElementById("map"));
map.setCenter(new GLatLng(37.4419, -122.1419), 13);
//--create the info tabs---
var infoTabs = [
new GInfoWindowTab("Name", "Gaurav"),
new GInfoWindowTab("Description","Software Developer, India")
];
//---add the click event for the marker---
var marker = new GMarker(map.getCenter());
GEvent.addListener(marker, "click",function() {
//---open the marker info tab---
marker.openInfoWindowTabsHtml(infoTabs);
});
//---add the marker---
map.addOverlay(marker);
//---add the marker IF WANT TO OPEN INFO AT PAGE LOAD---
marker.openInfoWindowTabsHtml(infoTabs);
}
}
</script>
</head>
<body onload="load()" onunload="GUnload()">
<div id="map" style="width: 500px; height: 300px">
</div>
<form id="form2" runat="server">
<div>
</div>
</form>
</body>
</html>
Write the above mention code in your project and press F5 to debug your project, now you can see your default.aspx in debug mode as shown below:
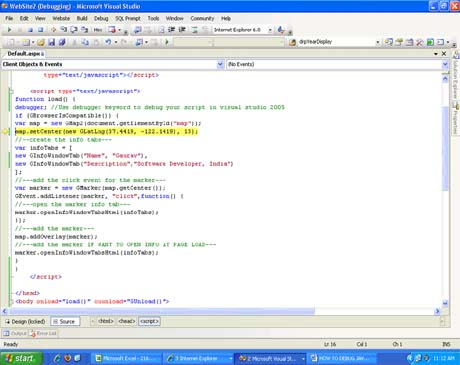
Figure 1.
Now you can debug your script by simply pressing F10 and easily track error in your script. After that press F5 to run your project and you will see the below given output in your browser window:
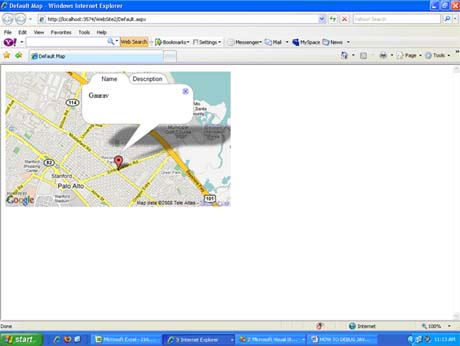
Figure 2.
Hope this will helps you, enjoy !!!