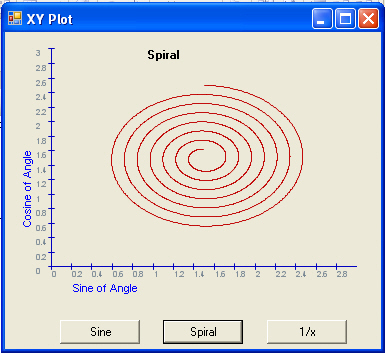
Figure 1 - Updated XY-Plot User Control
Introduction
This update of the xy-plot user control adds some significant improvements and aesthetic enhancements to the graphing code. All points are moved into a generic list instead of an object array making the code more readable. Properties are added for a title, coloring of data and axis, the number of ticks per axis, maximum and minimum values for the x and y axis and more. The graph is now double-buffered and anti-aliased to produce a smoother curve. The y-axis text is now rotated the correct way. There is an algorithm for making sure the tick values on the axis have reasonable values. Since the graph is more or less open source, feel free to e-mail suggestions at [email protected] to improve the control.
Storing Points in Generics:
The power of templates allow us to create a collection of points for our control. We could have used the existing value type PointF in our List collection, but we chose to create our own reference type called PointFloat giving us more flexibility in using our coordinate information. The collection of points declaration is shown below:
| private List<PointFloat> m_points = new List<PointFloat>(); |
Our previous XY-Plot control used an ArrayList which stores objects rather than the type in which we are interested.
| private ArrayList m_points = new ArrayList(); |
The difference between using the generic collection List<PointFloat> and the object collection ArrayList is that every time we want a PointFloat object out of an ArrayList we have to unbox it. This is an extra step that the program needs to take. In order to understand, let's look at an example:
Using an ArrayList:
| PointFloat nextPoint = (PointFloat)m_points[i]; // (1) get the point at index i and (2) unbox it |
Using a generic List<PointFloat>
| PointFloat nextPoint = m_points[i]; // get the point at index i |
As you can see, the generic list allows us to avoid the object class layer and go directly to manipulating the PointFloat object.
Algorithm for Creating Tics on the Axis
The axis are marked with values indicating a measure of where the point is located. In a way, an axis is like a ruler, so it should have value increments that "make sense" like a ruler. That means that the values should have precision values of 1, 2, or 5 in the last decimal spot because these values will eventually increment to a uniform unit. The algorithm below is an attempt to make this happen. First it calculates a raw increment based on the maximum and minimum axis values. Then it separates out the value to the right of the decimal. It then finds the most logical precision number that comes closest to the raw precision value and substitutes this value into the increment.
Listing 1 - Calculating the Closest logical increment for the Graph
/// <summary>
/// Calculate an increment value that makes sense
/// </summary>
/// <param name="min"></param>
/// <param name="max"></param>
/// <returns></returns>
private float CalculateIncrement(float min, float max)
{
// figure out a raw increment value to come close to
float increment = (max - min) /TicksPerAxis ;
// get the precision value on the right side of the decimal
float precision = increment - ((int) increment);
// round this value to a whole number, and track
// it's multiple
float multiple = 1;
while (precision < 1f)
{
precision *= 10;
multiple *= 10;
}
// these are the precision values we will allow on
// the right side of the decimal for our graph
float[] allowablePrecisions = new float[]{1, 2, 5};
// find the closest precision (1,2, or 5) to the precision
// value of our raw increment.
float minimumPrecision = allowablePrecisions[0];
foreach (float nextPrecision in allowablePrecisions)
{
if (Math.Abs(precision - minimumPrecision) > Math.Abs(precision - nextPrecision))
{
minimumPrecision = nextPrecision;
}
}
// determine a new precision value
precision = minimumPrecision/multiple;
// calculate the new increment by adding the precision
// to the integer value
increment = ((int) increment) + precision;
return increment;
} |
Smoothing the Data Line
The Graphics class comes with a SmoothingMode property that allows you to antialias your graphics line. There are also HighQuality and HighSpeed modes, but I think HighQuality is the same as Anti-alias mode and HighSpeed is the same as None.
| SmoothingMode |
Description |
| Antialias |
Provides antialias rendering |
| None |
No Antialiasing |
Table 1 - Smoothing Mode Enumeration Values
What is antialiasing? Anti-aliasing is a way to fool the eye into thinking a line is smooth instead of having jagged edges. The way anti-aliasing fools the eye is by putting shading around the jagged edges. The shading effect makes the jags look slightly fuzzy giving the illusion that the lines and curves are more "smooth".
Smoothing is accomplished in the Paint Event handler as shown in listing 2:
Listing 2 - Activating Smoothing in the Graphics Object
protected override void OnPaint( PaintEventArgs pe )
{
Graphics g = pe.Graphics;
g.SmoothingMode = SmoothingMode.AntiAlias; // smooth all lines and curves painted in this graphics object
... |
Rotating the Text Along the Y-Axis
Originally I tried rotating the text by calling DrawString with a property in StringFormatFlags called DirectiionVertical as shown in listing 3:
Listing 3 - Rotating Text for the Y-Axis Label using StringFormat in the Paint Event Handler
StringFormat theFormat = new StringFormat(StringFormatFlags.DirectionVertical);
g.DrawString(m_LabelY, GraphFont, Brushes.Blue, new PointF(ClientRectangle.Left , ClientRectangle.Top + 100), theFormat); |
Unfortunately, the text showed up reflected flipped from the way I wanted it to appear on the graph. Instead of using StringFormat, I resorted to drawing the string into a bitmap in memory, rotating the graphic surface of the bitmap, and drawing the bitmap onto the Graphics object of the canvas as shown in listing 4:
Listing 4 - Rotating the y-axis label and drawing it on the Graph
SizeF labelSize = g.MeasureString(m_LabelY, GraphFont);
// create a bitmap with the dimensions of the y-axis label
Bitmap stringmap = new Bitmap((int)labelSize.Height + 1, (int)labelSize.Width + 1);
// get a graphics object that will draw to the y-axis bitmap
Graphics gbitmap = Graphics.FromImage(stringmap);
// translate the graphics surface width of the the label text
gbitmap.TranslateTransform(0, labelSize.Width);
// rotate the graphics surface back 90 degrees
gbitmap.RotateTransform(-90);
// draw the string into the transformed graphics surface
gbitmap.DrawString(m_LabelY, GraphFont, Brushes.Blue, new PointF(0 , 0), new StringFormat(StringFormatFlags.NoClip));
// draw the bitmap containing the rotated string to the graph
g.DrawImage(stringmap, (float)ClientRectangle.Left, (float)ClientRectangle.Top + 100); |
Using the Control
Below is an example of using the control to draw a graph of a spiral. The first line of code resets the points in the graph. Then the next set of lines of code set up the properties and parameters such as the title of the graph, the axis titles and the max and min values of the axis. Finally we loop through the radians of a circle and calculate the x and y coordinates to add to the graph as shown in listing 5.
Listing 5 - Drawing the Spiral in the XY-Plot Control
private void btnSpiral_Click(object sender, System.EventArgs e)
{
// clear the graph
xyGraphControl1.Reset();
// set up the graph parameters and labels
xyGraphControl1.LabelX = "Sine of Angle";
xyGraphControl1.LabelY = "Cosine of Angle";
xyGraphControl1.XMinimum = 0f;
xyGraphControl1.XMaximum = 3f;
xyGraphControl1.YMinimum = 0f;
xyGraphControl1.YMaximum = 3f;
xyGraphControl1.Title = "Spiral";
// add the data into the graph
for (float i = 0; i < 6.28 * 7; i += 6.28f/500f)
{
xyGraphControl1.AddPoint((float)Math.Sin((double)i) *(1- i/50.0f) + 1.5f, (float)Math.Cos((double)i)* (1 - i/50.0f) + 1.5f);
}
// force the graph to redraw
xyGraphControl1.Invalidate();
} |
Conclusion
You are free to use the xy plot control in any of your projects to display your data. This control does not have some of the popular charting effects such as zooming, scrolling, real-time effects and more, but you are free to enhance it to drop in these features. The user control also will not work on the web. If you want a more professional charting tool with some of these bonus features you should check out Dundas Chart which is bound to give you what you need without the headache of trying to develop these complex features. Anyway, if you are carefully plotting your next project, consider doing so with the help of C# and GDI+.