Description
The Debug.Assert is one of the greatest tools for developers to use for creating solid, bug free code. The problem with using Debug.Assert lies when you are writing an ASP.Net web site or Web Service. By default with these types of projects, when an Assertion fails, Visual Studio will log the Assertion message to the Debut Output window. But thats it, no other type of notification that the Assertion failed. ASP.Net and Web Services do not have any built in ability to break into debug mode when an Assertion fails. This sample creates a dll that once referenced by your ASP.Net or Web Service app, just adding a small block of xml into your web.config file will cause the debugger to automatically break into your code.
Note on Assertions and this article
In this article, Im making the assumption that the reader knows the hows, whys, and whens to using Debug.Assert. Unfortunately, Assertions are a commonly misunderstood and misused debugging tool. To find out more on the Assertion, ready chapter 3 of John Robbins Debugging Applications for Microsoft .Net and Microsoft Windows. This book is an amazing resource on power debugging. Also read everything MSDN has to say about the System.Diagnostic namespace.
Assertions in WinForms and Console Applications
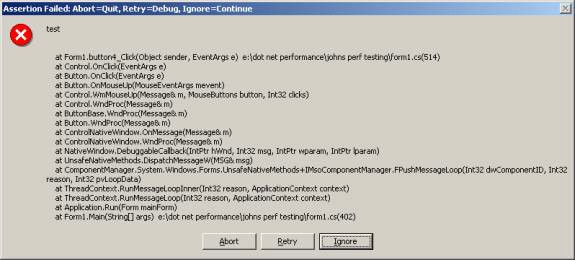
The Debug.Assert is one of the greatest tools for developers to use for creating solid, bug free code. When an Assertion fails in a WinForm application, by default, you get a message box (see Figure 1) that shows the Assertion message, the stack trace where the Assertion failed, and an option to break into debug mode on the line of code after the Assertion. If you click the Retry button, the debugger will kick in and let you inspect the values that failed the Assertion.
Figure 1
Enter ASP.Net and Web Services
The problem with using Debug.Assert lies when you are writing an ASP.Net web site or Web Service. By default with these types of projects, when an Assertion fails, Visual Studio will log the Assertion message to the Debut Output window. But thats it, no other type of notification that the Assertion failed. ASP.Net and Web Services do not have any built in ability to break into debug mode when an Assertion fails.
A Brief Overview of TraceListener objects
A TraceListener class is a class that handles message output for Debug and Trace classes (located in the System.Diagnostic namespace). The Debug and Trace classes have a static collection object called Listeners, which holds a list of TraceListener objects. By default this collection holds only one TraceListener object, the DefaultTraceListener. The .Net Framework also includes a TextWriterTraceListener and an EventLogTraceListener. When you call Debug.Assert or Debug.WriteLine, the runtime loops through each TraceListener in the Debug.Listeners collection and sends the each one the message that you provided. So if you added both the TextWriterTraceListener and the EventLogTraceListener objects to Debug.Listeners, youll get the Assertion message sent to Visual Studios debug output window, the event viewer, and a text file (You must configure each listener via their constructor, but that is outside the scope of this example).
So What Does This Have To Do With Breaking On An Assert?
The solution to this problem is a cool, but extremely simple one. Create your own custom TraceListener object that will handle breaking into the code. This isnt exactly what the TraceListener class was designed for, but it suites our needs here very nicely. To do this, create a new library project in Visual Studio and rename the default class to ASPNetDebugAssert, and have this class inherit from System.Diagnostics.TraceListener. Then override the 4 Write() and WriteLine() methods of the TraceListener base class. In each one of these overridden methods, make a call to BreakInCode(). The code for BreakInCode is listed below.
private void BreakInCode()
{
BooleanSwitch assertSwitch = new BooleanSwitch("BreakOnAssert", "");
if (assertSwitch.Enabled)
{
if (Debugger.IsAttached)
Debugger.Break();
else
Debugger.Launch();
}
}
This method is the workhorse of the dll (albeit, a very small workhorse indeed!). It first creates a BooleanSwitch object based on a value well later put in the ASP.Net or Web Services web.config file. If the BooleanSwitch is enabled it checks to see if a debugger is attached. If the debugger is attached to the running process, the code calls Debugger.Break() which will cause Visual Studio to break on the very next line after the Debug.Assert call. If the debugger is not attached to the running process, the code will try to launch the debugger.
And thats all there is to itwell, almost. When your code calls Debug.Assert() in an ASP.Net application and the Assertion fails, the Debug class will loop through each listener in its collection and call the Write() method on each one. When it calls our custom TraceListener class, the debugger is told to breakand Shazam!!!the debugger will kick in and stop on the next line of code in your ASP.Net application.
Configuring Your Listener In The Web.Config To Use ASPNetDebugAssert
Were not quite done here. In order for the BreakInCode() method to work correctly, we need to put a few things into the web.config file. The following block of xml is what youll have to add.
<system.diagnostics>
<switches>
<add name="BreakOnAssert" value="1" />
</switches>
<trace autoflush="true" indentsize="0">
<listeners>
<add name="MyListener" type="ASPNetDebugAssertion.ASPNetDebugAssert,ASPNetDebugAssertion" />
</listeners>
</trace>
</system.diagnostics>
The first thing in here is a definition for our BooleanSwitch. The element turns the BooleanSwitch on or off (enabled or disabled). Setting the value attribute to 0 will disable the switch and 1 will enable it (in the case of our custom dll, 1 will cause the debugger to break, 0 will not cause the debugger to break).
The second item in this xml block is the element. With this element, we can add and remove TraceListener objects to the Debug.Listeners collection without having to recompile our code. Ill leave it up to you to read up on these web.config elements in MSDN, but it should be obvious that this example adds our custom ASPNetDebugAssert TraceListener to the Listeners collection.
So How Do I Use This?
The final piece to this example is actually calling Debug.Assert in an ASP.Net application. There are a few things we have to do to piece this all together. First, compile your ASPNetDebugAssertion library in Release build mode. Then, in your ASP.Net or Web Service project, add a reference to the release version of the dll. (Note: If you compile the ASPNetDebugAssertion dll under debug mode, the debugger will use the debug symbols of our dll and break on the line right after Debugger.Break is called.). Next, copy and paste the web.config xml block listed above into your ASP.Net projects web.config file. Be sure to paste it inside the element, but OUTSIDE of the element.
Once this is done, your project is setup and ready to Assert! Somewhere in the code behind of one of your web forms, add the following lines of code.
private void Button1_Click(object sender, System.EventArgs e)
{
Debug.Assert(sender == null, "sender obj is null");
string assertTest = "Hey, this worked";
this.TextBox1.Text = assertTest;
}
When the application is first started, the Debug class will check the web.config file and look to see if any TraceListeners should be added to its Listeners collection. Once Debug.Assert is called, it will send The assertion worked!! to each TraceListener, including ours. When our dll is called, the BreakInCode() method will do its work and the debugger will break on the line of code immediately following the Debug.Assert. And thats it!!! You now get debugger breaking when you use Assertions, just like you do (almost) with a WinForm application. If you want to turn the break mode off, just change the BooleanSwitch definition in the web.config to 0.