An oscilloscope is probably the most important instrument for observing and measuring electronic circuits. It allows you to observe timing, voltages, slopes, curves, and spikes of an electronic signal. A good digital oscilloscope can easily run you over $1000, but this scope will cost you a grand total of $40 for the kit, perhaps the cheapest scope you will ever buy.
At the heart of the .NET Scope is the GP-3 PC I/O Board PIC Microcontroller circuit. This is a kit brought from AWC that allows you to read digital an analog signals and return the results through the serial port of your PC. You can also create PWM signals, tones, high/low signals, pulses, and counters with GP-3 circuit and control them with your PC.
Figure 1 - Poorman's Oscilloscope showing a 5 Khz PWM Signal
As with any kit, there is one slight catch. You have to put it together. The GP-3 Board requires some minimum soldering skills, in which admittedly I was a little rusty. Also a general knowledge of electronics is helpful, although not completely necessary. The board is fairly easy to assemble, and AWC guides you on every detail. It also gives you helpful hints on how to test each individual subassembly on the board including the power supply circuit, the serial port circuit, and the PIC microcontroller circuit. There are relatively few parts, and it shouldn't take you more than a few hours to assemble the full board(longer if you put one of the parts in backwards, like I did ;-) . Below is the final assembly after barely soldering all the parts without burning my fingers off (Never give a soldering iron to a computer programmer). The GP-3 is the board that is hooked to the serial port on the right. The long integrated circuit on the GP-3 board in figure 2 is the PIC16F873A microcontroller that we can program from the PC.
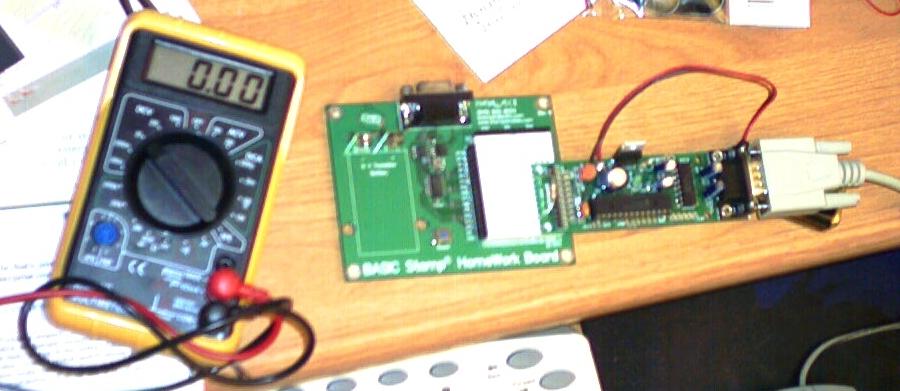
Figure 2 - GP-3 PIC Circuit plugged into a prototype board and connected to the serial port
The reason I chose the GP-3 board to work with my .NET oscilloscope, is because AWC has created an ActiveX control which can be imported right into my Windows Form Project. The ActiveX control allows me to perform all of the functions of the GP-3 board through the simple methods and properties of the control. I've listed a few of the methods in the table below that are utilized by this project:
| Method |
Description |
Example |
| CommPort |
Tells GP-3 which port to use |
axGP3IO1.CommPort = 1; // select comm port 1 |
| portopen |
Opens/Closes the COM serial port |
axGP3IO1.portopen = true; // open comm port 1 |
| led |
turn on/off the LED on the board |
axGP3IO1.led = true; // light the LED |
| pwm |
Create a PWM signal with duty cycle (0-255) and duration |
axGP3IO1.pwm(1, 128, 500); // set up a pwm on pin 1 at 50% duty cycle and 500
// milliseconds |
| a2d |
Read the 10-bit analog-to-digital channel voltage from 0 to 5V (0-1024) |
n = axGP3IO1.a2d(0); // get the voltage equivalent value from channel #0 and
// assign to n |
| high |
Set a pin to a high state (+5 V) |
axGP3IO1.high(1); // set pin 1 to a high state |
| low |
Set a pin to a low state (0 V) |
axGP3IO1.low(1); // set pin 1 to a low state |
| inp |
Get the state of an input pin |
n = axGP3IO1.inp(1); // get the state of pin 1 and assign to n |
| repeat |
Repeat the next measurement a number of times. (used to take rapid repeated measurements) |
axGP3IO1.repeat(xmax + 1); // repeat the next measurement taken xmax+1 times
// and buffer the results |
| readword |
Read the next buffered result created from the repeat command above |
n = axGP3IO1.readword(); // read the next buffered result into n |
Table 1 - Commands of the ActiveX Control used to control the GP-3 board
Once I built the board, I first needed to see if I could program it at all, so I plugged it into the serial port, hooked up the battery and ran the following C# Code to see if I could just light the LED. (Note you need to first drag the ActiveX control into your form, in order to utilize the GP-3 functionality). As you can see by the listing, lighting the LED is a fairly straightforward task in code.
Listing 1 - Lighting the LED
private
void button1_Click(object sender, System.EventArgs e)
{
this.axGP3IO1.led = true;
}
After seeing that the board worked and that even a guy who hasn't picked up a soldering iron in 10 years could build this project, I decided to get a little more ambitious and create a test that would blink the LED ten times. It took me some time to figure out how to cause a delay between blinks using the PIC, but I finally found something in the instructions that lead the way. By creating a pwm signal on one of the pins for a duration, the PIC would hang for that duration. I suppose I could have just created the delay using the timer in .NET on the PC side, but I thought it would be more challenging to use the PIC chip as the timer.
Listing 2 - Blinking an LED 10 times using the GP-3 board
private
void button2_Click(object sender, System.EventArgs e)
{
Console.WriteLine("Start");
for (int i = 0; i < 10; i++)
{
// light the LED for a 1/2 second
this.axGP3IO1.led = true;
this.axGP3IO1.pwm(1, 128, 500);
// turn off the LED for a 1/2 second
this.axGP3IO1.led = false;
this.axGP3IO1.pwm(1, 128, 500);
}
Console.WriteLine("Stop");
}
I suppose I should have stopped there with the challenge of controlling hardware. After all, here I am a software programmer trying to control hardware and somehow this act goes against the laws of physics. Nevertheless, I became curious about looking at some of the signals produced by the PIC, so I decided to try to create a virtual oscilloscope on the pc that takes advantage of the A/D Converter Channels on the PIC itself. I figured, I can use these channels on the PIC to measure the signals outputted from the PIC.
.NET Oscilloscope
The .NET scope is a simple storage scope that allows to scale both time and voltage. There are also two knobs on the side of the scope (created from the volume control in a previous article) that allow you translate the horizontal and vertical position of the signal. The oscilloscope has two modes: continuous and storage. You can store a particular trace simply by hitting the Store Button. After a trace is stored you can also adjust its position and scale using all the available knobs and controls. You can return to continuous mode by hitting the store button again.
The .NET oscilloscope uses the a2d command in conjunction with the repeat command on the GP-3 in order to rapidly sample several voltage readings from the PIC. Below is the code that takes 450 consecutive readings from the A/D channel and plots them to the virtual oscilloscope using GDI+. Note that the controls are taken into account to scale and translate the final x and y coordinate positions.
Listing 3 - Plotting A/D Samples to the Oscilloscope
private
void RefreshScope (Graphics g)
{
int xmax = 450; // number of sample points
int ymax = 225; // maximum y value
int xlast = -1;
int ylast = 0;
int xDraw = 0;
int yDraw = 0;
// put the a/d readings into repeat mode for 450 readings
axGP3IO1.repeat(xmax + 1);
int n = 0;
// read the values on channel #0 of the A/D converter
n = axGP3IO1.a2d(0);
// read each value from the buffer and plot the sample on the scope
for (int xpos = 0; xpos <xmax; xpos++)
{
// if the storage scope is set, use the values in the storage array to plot the voltage
if (StorageOn)
n = StorageArray[xpos];
else // otherwise just save the a/d values in the storage array for later
StorageArray[xpos] = n;
// n between 0 and 1023
System.Single y = 0;
System.Single volt = 0;
int yint = 0;
// normalize the voltage reading
y = (float)n/ 1024.0f;
if (n > 64000)
y = 0;
// scale the voltage reading to 5 volts
y = y * 5.0f;
// scale the voltage according to the voltage scale control
yint = (int)((float)y/(float)numericUpDown1.Value);
// offset the voltage based on the y position dial
if (this.volumeControl1.Volume < 5)
yint += (this.volumeControl1.Volume % 5);
else
yint -= (this.volumeControl1.Volume % 5);
// place the y reading into the correct coordinate system
// by subtracting from the maximum value
yint = ymax - yint * ymax/5;
yDraw = yint;
// don't draw the first sample point, use it as
// a starting sample point
if (xlast != -1)
{
// scale the x-value based on the TimeScale control
// translate the x-position by the x-position congrol
xDraw = xpos * (int)this.TimeScaleControl.Value + this.XPositionControl.Volume * 5;
// Draw the scaled sample point by connecting
// the previous scaled sample point to the current
// scaled sample point
if (xDraw < kScopeWidth)
g.DrawLine(Pens.LawnGreen, xlast, ylast, xDraw, yint);
}
// remember the current sample point to allow for connecting
// the next sample point
xlast = xDraw;
ylast = yDraw;
// read the next a/d value from the buffer
if (xpos != xmax)
{
n = axGP3IO1.readword();
}
}
}
PWM Signal
The PWM signal is generated by the PIC and fed back into the A/D channel to plot on the scope. The code for generating the PWM signal is shown below. Note that the command for generating this PWM signal is slightly different than the one we used to generate a PWM signal on pin 1 in listing 2. The PWM signal generated for the A/D is the internal hardware PWM signal and can be set to run continuously at any frequency from 1225 Hz to 32767 Hz. We set the signal to run at 5000 Hz in the code below:
Listing 4 - Generating the Hardware PWM 5KHz signal
private
void button4_Click(object sender, System.EventArgs e)
{
// set up the continous pwm wave at 50% duty cycle, 5 KHz
this.axGP3IO1.pwm(-1, 128, 5000);
}
Scope Sampling Rate
A PWM wave of 5000hz produces a wave with period 1/5000 = .0002 seconds or 200 ms. If we look at figure 1 at the beginning of this article, we see that a wave has a full cycle after about 3 horizontal units. That means each unit is about 200 ms / 3 or 70 ms. It appears from the diagram that the scope is capable of sampling at least every 70 ms in repeat sampling mode. (That is, if we are not aliasing and missing samples). The wave below in figure 3 is a measurement of the pwm wave set at 100 Hz. As you can see, the samples are more clearly visible at the lower sampling rate. It is more likely that we are actually sampling at a rate closer to this frequency (a sample every 1 millesecond)
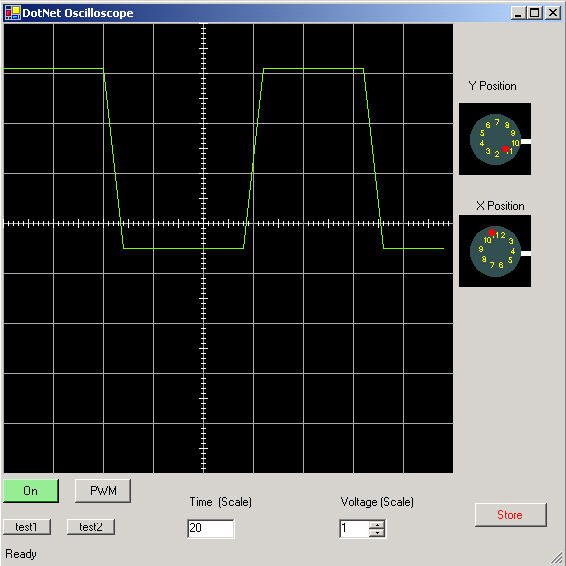
Figure 3 - 100 Hz PWM Wave
We can get a better idea of the sampling rate by alternating colors by inserting the following lines of code into the RefreshScope method:
Listing 5 - Toggle the color red and green every other sample
if
(nToggleColor % 2 == 0)
g.DrawLine(Pens.LawnGreen, xlast, ylast, xDraw, yint);
else
g.DrawLine(Pens.Red, xlast, ylast, xDraw, yint);
nToggleColor++;
This produces the 100Hz PWM signal graph shown below in figure 4. We can calculate from the now distinct samples how quickly we are sampling data. There are approximately 14 samples in 1 full 100 Hz cycle or a period of 1/100 = 10 ms. If we divide the 14 samples into 10 milliseconds, we get a sampling rate of 1 sample every .71 ms or 710 ms (which is a magnitude of 10 greater than we originally predicted).
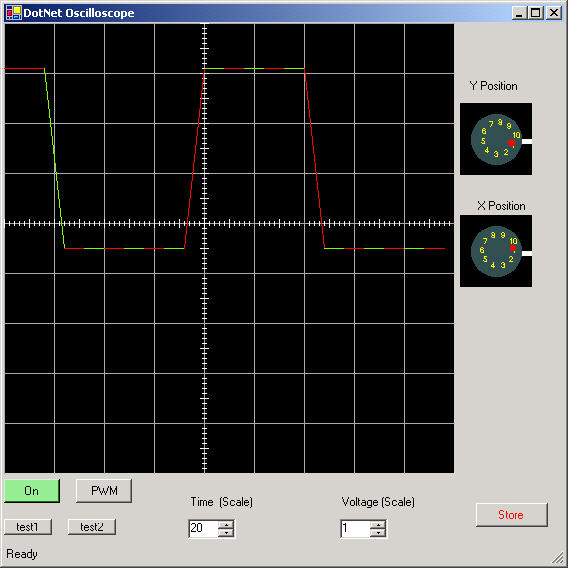
Figure 4 - Clearly Displaying the Samples of the 100Hz Signal
Conclusion
The .NET Oscilloscope is an interesting demonstration of how you can interface .NET projects to the outside world. There is no limit with what you can do with the GP-3 board. You can control switches in the house, create a musical synthesizer, monitor the security of your surroundings, create a night light. You are only limited by your imagination with this simple interface . If you are interested in duplicating this project, check out the AWC site and be prepared to enter the real-time world of C# and .NET!