

Introduction
This article is all about the basics of D3.JS, not the full details but thorough enough to provide at least a feeling and fundamental understanding of it. In this article, I am including a basic overview of this entire subject, an introductory part of D3.JS, some important features, the procedure for creating a chart, and some other details too.
Outlines
- Overview
- Introduction
- Features
- Procedure
- Chart Creation
- Demo
- Key Points
- Conclusion
Overview
As I promised in my previous article, I'll take you on a journey of D3.JS. I am here as your guide and will take you through this interesting ride of Data Visualization (using D3.JS). In this article, I'll be covering its introductory part likely to be its basics and how it is started, its features, the procedure for creating charts, some key points and finally the conclusion of the entire journey.
Definition | D3.JS
So what does Data Visualization mean?
Charts
Diagrams
Other forms of data diagrams
Something else.
Some very good and handsome features of D3.JS are as follows:
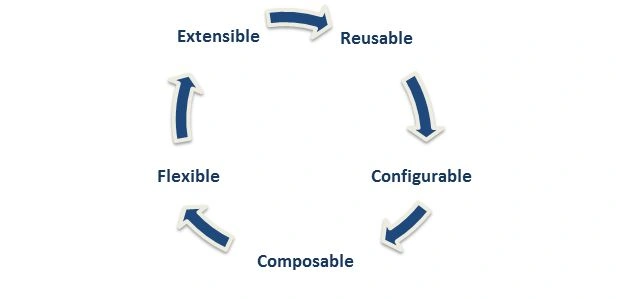
Features
- Reusable
D3.JS is reusable. This is the main feature of it. You can use the same basic functionality of D3.JS in creating various types of charts. What you only need to do is make some rare changes in a configuration only.For code reusability it uses:
- Plugins
- Components
- Configurable
It is an open-source project on GitHub. You are always welcome to configure it and make some changes according to you and depending on the needs of your project functionality.It's too easy to do that. It also works very fine with all the modern available browsers (IE 8+, Chrome, Mozilla, Safari, and so on).
- Composable
Composable means it can be easily composed of simple and base functions of JavaScript. So if you have knowledge of HTML, CSS, and JavaScript then you can do better.What you need are some hands-on labs and a little practice.
- Flexible
It's flexible too as I said in the composable point. So you can always use D3.JS as you need to for your project requirements and extend it to any level and with any type of common data (XML, JSON, CSV, and so on).Some other features of D3.JS are as follows:• Extensible
• Repeatable
• Easy to Use
• Interactive
Procedure
The 3 main steps of creating a chart are using D3.JS as shown in the following figure:
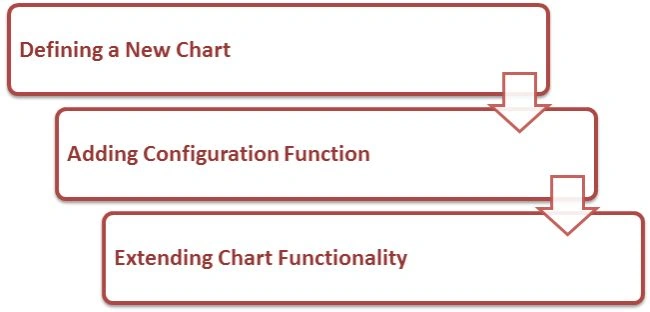 First of all, we simply need to include D3.Js functionality in our snippet, for that either you can download its a library from the official website or you can directly use its functionality by simply including its script source as:
Chart Creation
- <script src=http://d3js.org/d3.v2.min.js type=”text/javascript”></script>
Now for the structure of D3.JS.
- <script>
- // Initialization
- d3.Chart("Chart_Type",
- {
- initialize function()
- {
- ----
- ----
- Do_Something;
- ----
- ----
- }
- });
- // chart rendering properties
- var mychart = d3.select(#container)
- .append("div#is")
- .chart("Chart_Type");
- // Providing data values
- myChart.draw([1,2,3,4,5]);
- </script>

HTML Snippet
- <!DOCTYPE html PUBLIC "-//W3C//DTD XHTML 1.0 Strict//EN" "http://www.w3.org/TR/xhtml1/DTD/xhtml1-strict.dtd">
- <html>
- <head>
- <title>Bar Chart</title>
- <meta http-equiv="X-UA-Compatible" content="IE=9">
- <link href="Style1.css" type="text/css" />
- </head>
- <body>
- <div id="chart"></div>
- <script src="http://d3js.org/d3.v2.min.js"></script>
- <script>
- function renderChart() {
- // var width = 1020,
- // height = 720,
- // Attributes
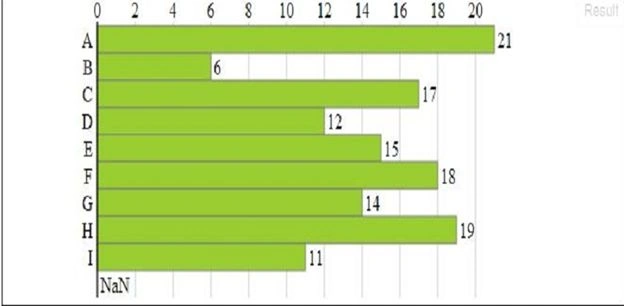
- var data = d3.csv.parse(d3.select('#csv').text());
- var valueLabelWidth = 40; // space reserved for value labels (right)
- var barHeight = 20; // height of one bar
- var barLabelWidth = 100; // space reserved for bar labels
- var barLabelPadding = 5; // padding between bar and bar labels (left)
- var gridLabelHeight = 18; // space reserved for gridline labels
- var gridChartOffset = 3; // space between start of grid and first bar
- var maxBarWidth = 420; // width of the bar with the max value
- // Accessor functions
- var barLabel = function (d) { return d['Name']; };
- var barValue = function (d) { return parseFloat(d['Salary(PM)']); };
- // Scales
- var yScale = d3.scale.ordinal().domain(d3.range(0, data.length)).rangeBands([0, data.length * barHeight]);
- var y = function (d, i) { return yScale(i); };
- var yText = function (d, i) { return y(d, i) + yScale.rangeBand() / 2; };
- var x = d3.scale.linear().domain([0, d3.max(data, barValue)]).range([0, maxBarWidth]);
- // Svg container element
- var chart = d3.select('#chart').append("svg")
- .attr('width', maxBarWidth + barLabelWidth + valueLabelWidth)
- .attr('height', gridLabelHeight + gridChartOffset + data.length * barHeight);
- Open Source Framework
- It is a JavaScript library
- It is not a monolithic approach
- Allows code reusability
- It is a visualization library
- Used for data manipulation
- Works effectively with all the browsers
- Uses plugins and componentsWe need to include<script src=http://d3js.org/d3.v2.min.js” type=”text/javascript”></script>
Asjad ShafiPosted May 6, 2021, 2:06 PM
I am working with d3 on wpf platform. However, so far no luck on markergraph and using logrithmic data transform
Upendra Pratap ShahiPosted Dec 18, 2015, 9:10 AM
nice one sir..
Abhishek JaiswalPosted Apr 8, 2015, 5:59 AM
thanks buddy! :)
Gowtham RajamanickamPosted Apr 7, 2015, 6:21 AM
good one..
Jaganathan BantheswaranPosted Nov 6, 2014, 1:15 AM
Nice abhishek :)
Abhishek JaiswalPosted Sep 1, 2014, 12:07 PM
Thanks! :)
Guest UserPosted Sep 1, 2014, 3:26 AM
good one