

Area Chart displays the statistical data in a graphical format. It renders a chart by one or more series values. It is compatible with any browser which supports SVG and also Internet Explorer higher than 9.
You can learn more in my previous parts here:
There are two type of Area Charts.- Stacked Area Chart
- Basic Type Area Chart
Let’s see initial code with its output then we can check the properties in detail.
- <ajaxToolkit:AreaChart ID="AreaChart1" runat="server" 2.
- ChartHeight="300" ChartWidth="450" ChartType="Basic
- ChartTitle="Pakistan versus European Widget Production"
- CategoriesAxis="2007,2008,2009,2010,2011,2012"
- ChartTitleColor="#0E426C" CategoryAxisLineColor="red"
- ValueAxisLineColor="REd" BaseLineColor="Red">
- <Series>
- <ajaxToolkit:AreaChartSeries Name="Pakistan"
- AreaColor="Green" Data="110, 189, 255, 95, 107, 140" />
- <ajaxToolkit:AreaChartSeries Name="Europe"
- AreaColor="Blue" Data="49, 77, 95, 68, 70, 79" />
- </Series>
- </ajaxToolkit:AreaChart>
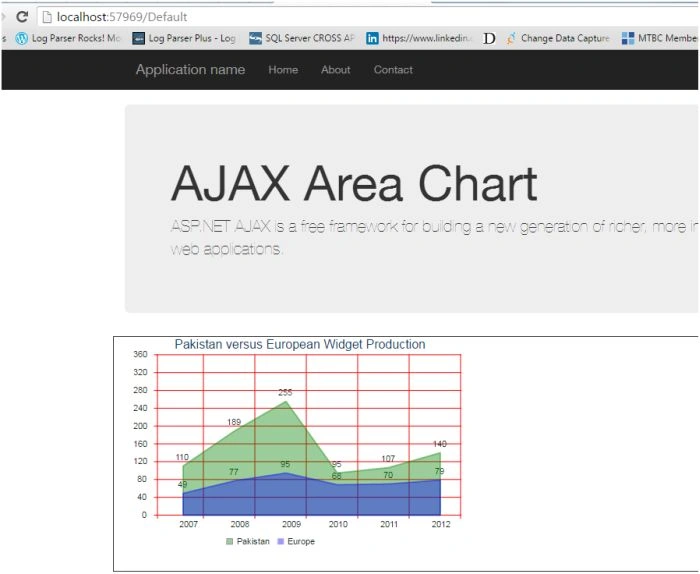
Properties
- ChartHeight
By using this property you can customize the height of the chart.
ChartHeight="500"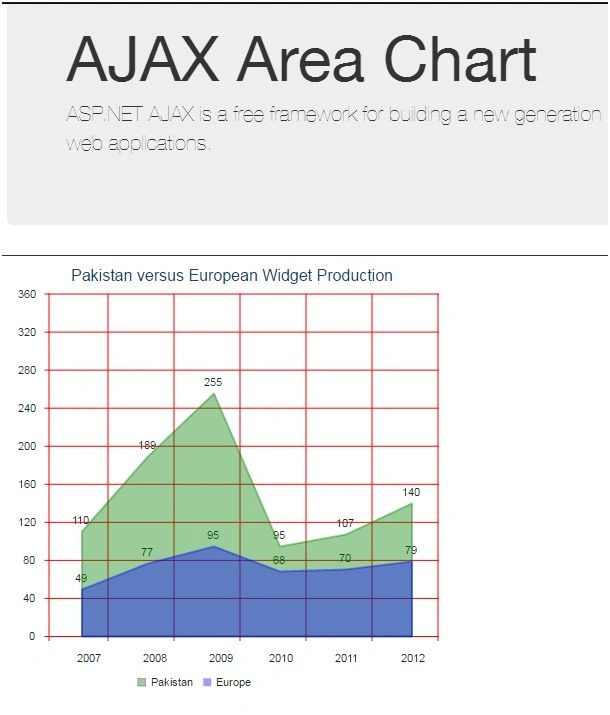
- ChartWidth
You can customize the chart width by using this property by defining the units.
ChartWidth="800"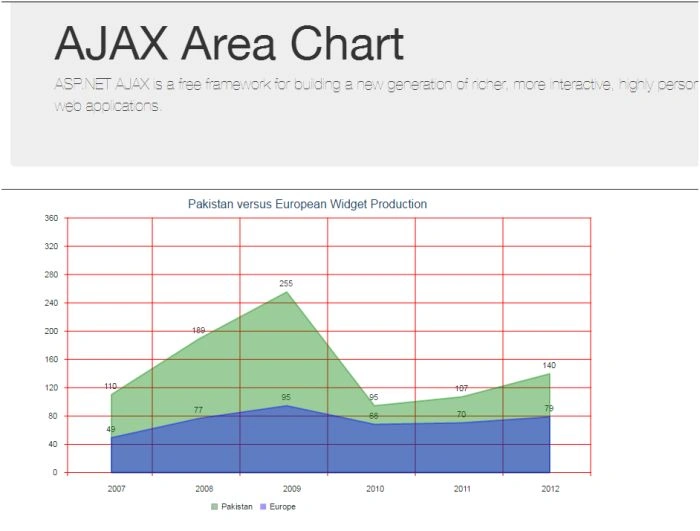
- ChartTitle
You can customize the area chart title by using the property
ChartTitle="Pakistan versus European Widget Production"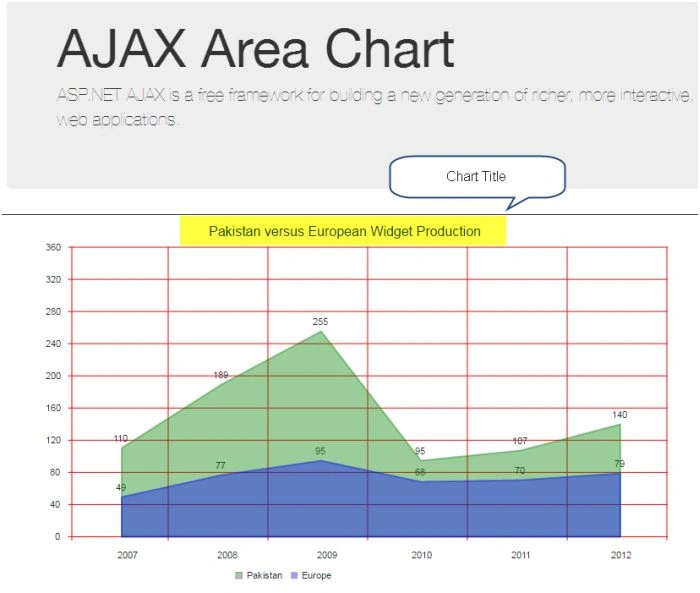
- CategoryAxis
A mandatory field. You need to provide a set of values for the category axis to create a line chart.
CategoriesAxis="2011,2012,2013,2014,2015,2016"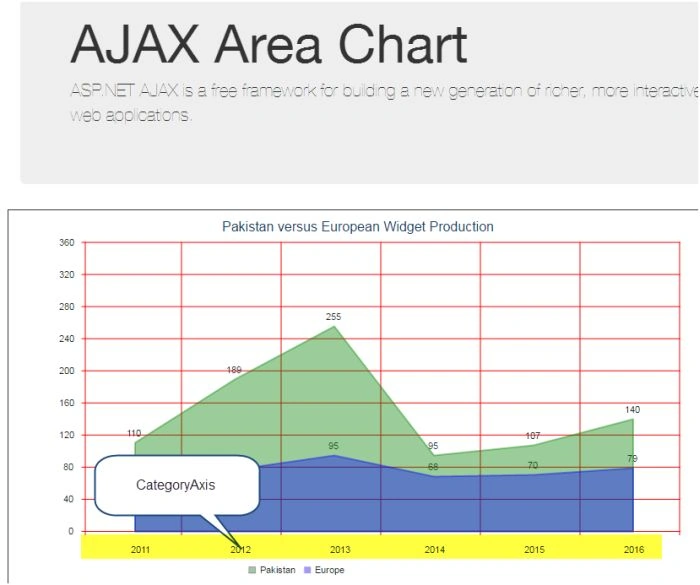
- ChartType
There are two types of area chart types and you can set from here by using the Property: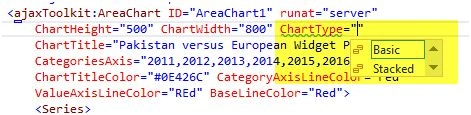
- Stacked
- Basic
Stacked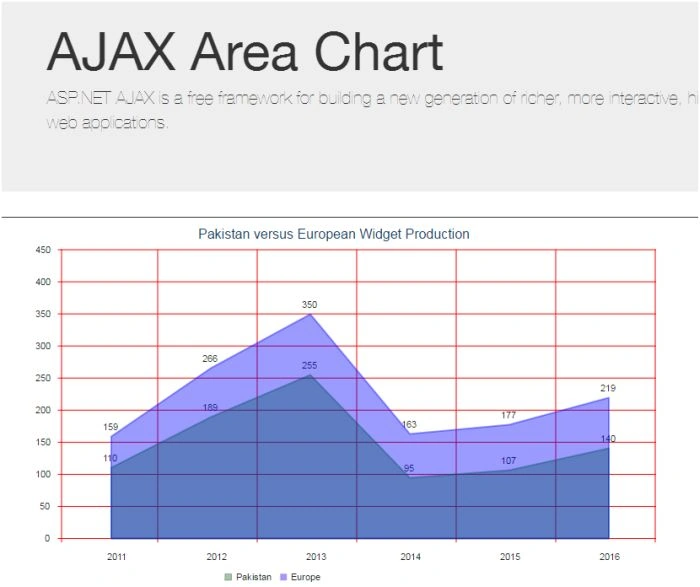
Basic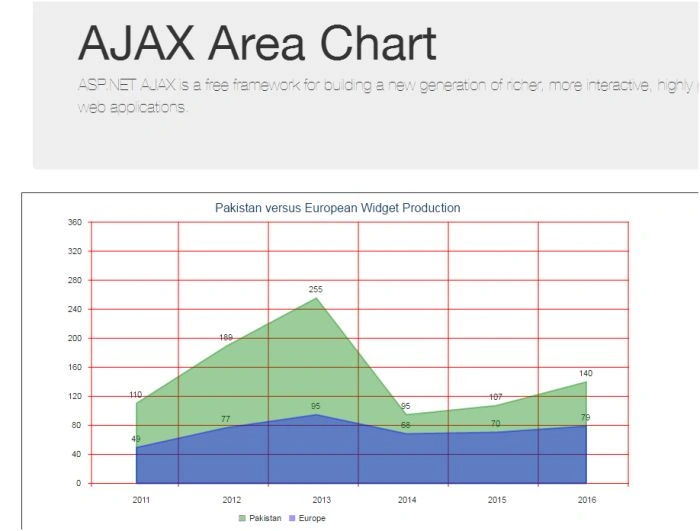
- Theme
You can define the Cascading style sheet to color your chart. - ValueAxisLines
This property enables you to set the interval size for the value axis line. The default value is 9, you can give a unit value to this property to how many lines to be shown.
ValueAxisLines="20"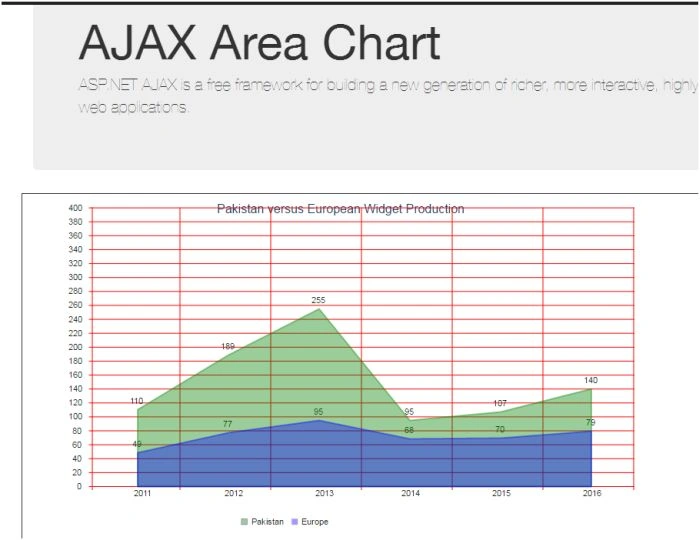
- ChartTitleColor
This property enables you to set the font color of the chart title. You can customize what color value you want.
ChartTitleColor="#0E426C"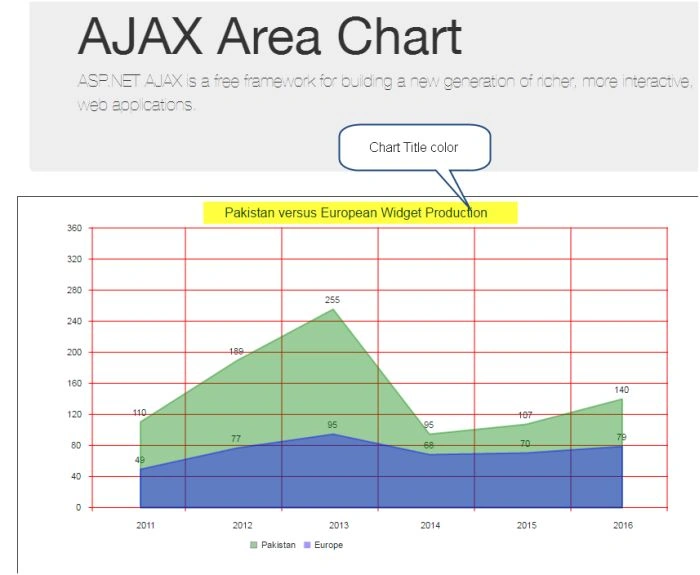
- CategoryAxisLineColor
This property enables you to set the color of the category axis lines.
CategoryAxisLineColor="Black"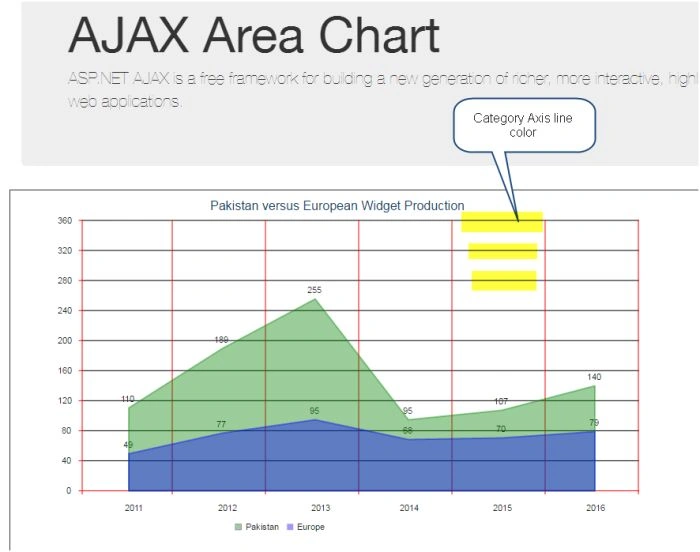
- ValueAxisLineColor
This property enables you to set the the color of the value axis lines.
ValueAxisLineColor="REd"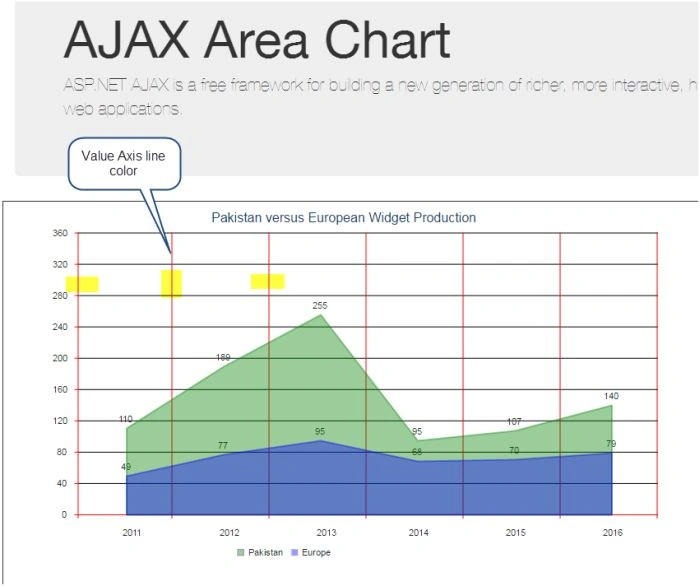
- BaseLineColor
This property enables you to set the color of the base lines of the chart.
BaseLineColor="Purple"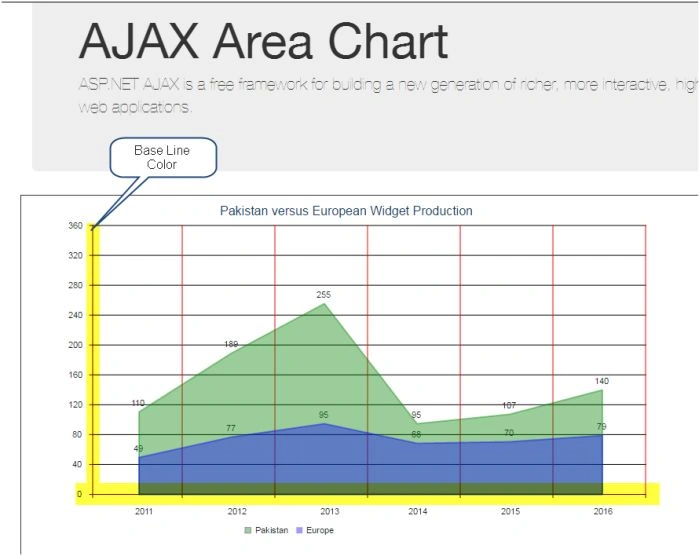
- AreaChartSeries Properties:
- <Series>
- <ajaxToolkit:AreaChartSeries Name="Pakistan"
- AreaColor="Green" Data="110, 189, 255, 95, 107, 140" />
- <ajaxToolkit:AreaChartSeries Name="Europe"
- AreaColor="Blue" Data="49, 77, 95, 68, 70, 79" />
- </Series>
- Name
This is required and you need to provide the name of series.
Name="Pakistan"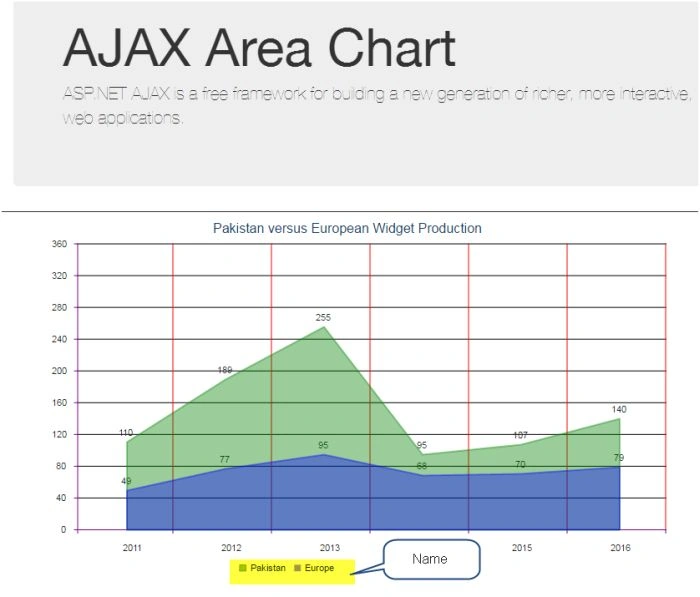
- AreaColor
This property enables you to set the color of area for a particular series.
AreaColor="Green"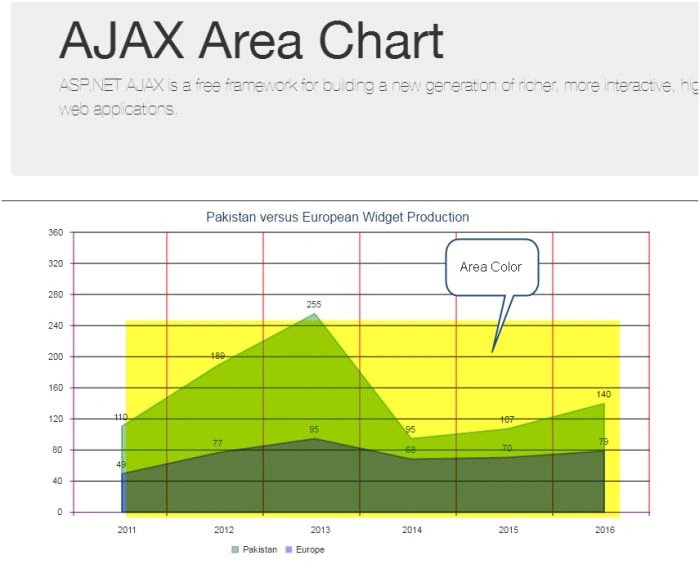
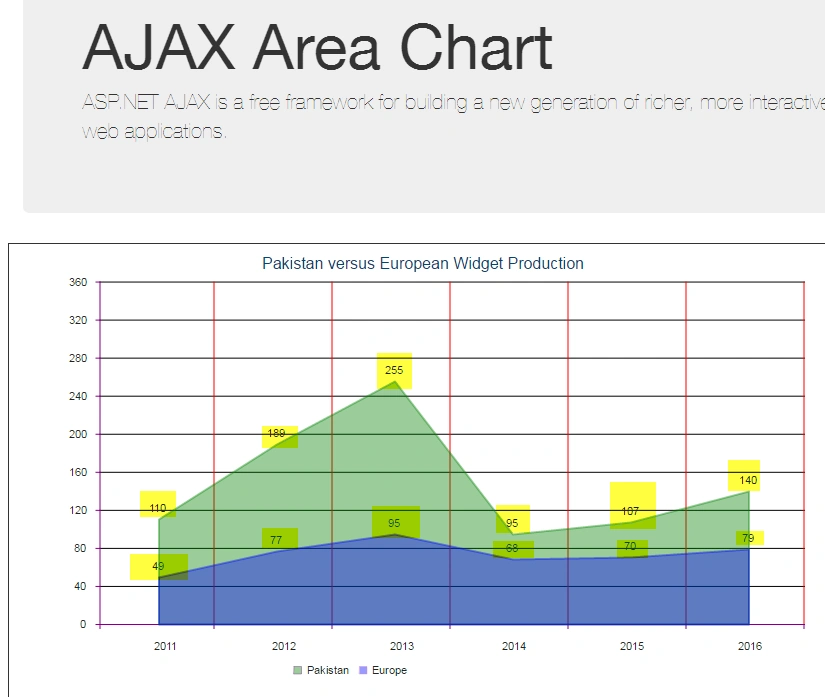
- Data
This property is required and provides data for a particular series.
Data="110, 189, 255, 95, 107, 140"
Delpin Susai RajPosted Aug 28, 2016, 5:00 AM
Nice
KkPosted Jul 29, 2016, 3:16 AM
Thank you for Responding. Is it not possible to do export any type of Ajax control Toolkit chart.i am using Ajax control Toolkit Line chart for exporting. and which type of line chart is better to use for exporting to excel.
KkPosted Jul 28, 2016, 3:32 AM
Thank you for your share sir but Is it possible to export this ajax using chart to excel(OpenOffice/Libra Office). It is possible to do can you please tell me it is very need to me.
Santhakumar MunuswamyPosted Jun 9, 2016, 12:44 AM
Thank you for nice share
Jaipal ReddyPosted Jun 7, 2016, 3:09 AM
good series
Sonu ChaudharyPosted Jun 6, 2016, 9:45 AM
good one...
Vignesh ManiPosted Jun 6, 2016, 5:25 AM
Nice
RajaPosted Jun 6, 2016, 12:22 AM
Nice article...
Debasis SahaPosted Jun 6, 2016, 12:20 AM
Good One..
Michael GriffithsPosted Jun 5, 2016, 2:50 AM
Nicely done