

I am using Highchart plugin to generate stack column chart. Here, I will use the same concept to create a web method in a web service and calling those methods in jQuery Ajax.
Step 1: Create a table as in the following:
- CREATE TABLE tblRevenue(
- Id int primary key IDENTITY(1,1) NOT NULL,
- year varchar](4) NULL,
- quarter [varchar](4) NULL,
- amount bigint NULL
- )
But in real time scenario you might get data from one or more tables using joins.
After completion of table design, enter some of the test data into the table to work for our sample.
I have attached script in sample download files, you can use that script to execute into the database.

Step 2: Create a stored procedure.
- CREATE PROCEDURE Pr_getrevenue
- AS
- BEGIN
- SELECT * FROM
- (SELECT year,quarter,Sum(amount)amount
- FROM tblrevenue
- GROUP BY year,quarter) AS s
- PIVOT ( Sum(amount)
- FOR [quarter] IN ([Q1],[Q2],[Q3],[Q4])
- )AS pv
- END
Step 3: Create an ASP.NET Web service. Add an .asmx page to the current solution and modify the code as in the following example:
- using System;
- using System.Collections.Generic;
- using System.Linq;
- using System.Web;
- using System.Web.Services;
- using System.Data; //
- using System.Data.SqlClient; //
- [WebService(Namespace = "http://tempuri.org/")]
- [WebServiceBinding(ConformsTo = WsiProfiles.BasicProfile1_1)]
- // To allow this Web Service to be called from script, using ASP.NET AJAX, uncomment the following line.
- [System.Web.Script.Services.ScriptService]
- public class ChartWebService: System.Web.Services.WebService
- {
- public class RevenueEntity
- {
- public string year
- {
- get;
- set;
- }
- public int quarter1
- {
- get;
- set;
- }
- public int quarter2
- {
- get;
- set;
- }
- public int quarter3
- {
- get;
- set;
- }
- public int quarter4
- {
- get;
- set;
- }
- }
- [WebMethod]
- public List < RevenueEntity > GetRevenueDetails()
- {
- List < RevenueEntity > revenues = new List < RevenueEntity > ();
- using(SqlConnection con = new SqlConnection("Data Source=.;Trusted_Connection=true;DataBase=test"))
- {
- using(SqlCommand cmd = new SqlCommand())
- {
- cmd.Connection = con;
- cmd.CommandType = CommandType.StoredProcedure;
- cmd.CommandText = "Pr_getrevenue";
- SqlDataAdapter da = new SqlDataAdapter(cmd);
- DataSet ds = new DataSet();
- da.Fill(ds, "Revenue");
- if (ds != null)
- {
- if (ds.Tables.Count > 0)
- {
- if (ds.Tables["Revenue"].Rows.Count > 0)
- {
- foreach(DataRow dr in ds.Tables["Revenue"].Rows)
- {
- revenues.Add(new RevenueEntity
- {
- year = dr["year"].ToString(), quarter1 = Convert.ToInt32(dr["Q1"]),
- quarter2 = Convert.ToInt32(dr["Q3"]), quarter3 = Convert.ToInt32(dr["Q3"]), quarter4 = Convert.ToInt32(dr["Q4"])
- });
- }
- }
- }
- }
- }
- }
- return revenues;
- }
- }
[System.Web.Script.Services.ScriptService]
Step 4: Add jQuery references as in the following:
- <script src="Script/jquery.min.js" type="text/javascript"></script>
- <script src="Script/highcharts.js" type="text/javascript"></script>
Step 5: Implement jQuery Ajax as in the following.
- <script type="text/javascript">
- $(document).ready(function() {
- $.ajax({
- type: "POST",
- contentType: "application/json; charset=utf-8",
- url: "Services/ChartWebService.asmx/GetRevenueDetails",
- data: "{}",
- dataType: "json",
- success: function(Result) {
- Result = Result.d;
- var series = [];
- var categories = [];
- var quarter1 = [];
- var quarter2 = [];
- var quarter3 = [];
- var quarter4 = [];
- for (var i in Result) {
- categories.push(Result[i].year);
- quarter1.push(Result[i].quarter1);
- quarter2.push(Result[i].quarter2);
- quarter3.push(Result[i].quarter3);
- quarter4.push(Result[i].quarter4);
- }
- series.push({
- name: 'Quarter 1',
- data: quarter1
- },
- {
- name: 'Quarter 2',
- data: quarter2
- },
- {
- name: 'Quarter 3',
- data: quarter3
- },
- {
- name: 'Quarter 4',
- data: quarter4
- }
- );
- BindChart(categories, series);
- },
- error: function(xhr) {
- alert('Request Status: ' + xhr.status + ' Status Text: ' + xhr.statusText + ' ' + xhr.responseText);
- }
- });
- });
- function BindChart(categories, series) {
- $('#container').highcharts({
- chart: {
- type: 'column'
- },
- title: {
- text: 'Stack Column Chart Demo'
- },
- xAxis: {
- categories: categories,
- labels: {
- style: {
- color: 'black',
- fontWeight: 'bold',
- fontSize: '14px'
- },
- }
- },
- legend: {
- itemStyle: {
- fontSize: '15px',
- font: '15pt Trebuchet MS, Verdana, sans-serif',
- color: '#0000FF'
- }
- },
- yAxis: {
- min: 0,
- title: {
- text: 'Amount in (Rs.)'
- },
- labels: {
- style: {
- color: 'black',
- fontWeight: 'bold',
- fontSize: '12px'
- }
- },
- stackLabels: {
- enabled: true,
- style: {
- fontWeight: 'bold',
- fontSize: '15px',
- color: 'black'
- }
- }
- },
- tooltip: {
- formatter: function() {
- return '<b>' + this.x + '</b><br/>' +
- this.series.name + ': ' + this.y + '<br/>' +
- 'Total: ' + this.point.stackTotal;
- }
- },
- plotOptions: {
- column: {
- stacking: 'normal',
- dataLabels: {
- enabled: true,
- color: (Highcharts.theme && Highcharts.theme.dataLabelsColor) || 'white',
- style: {
- textShadow: '0 0 3px black'
- }
- }
- }
- },
- series: series
- });
- }
- </script>
Step 6: UI Design as in the following.
- <div id="container">
- </div>
Step 7: Check output in the browser (see below screenshot of Stack Column Chart).
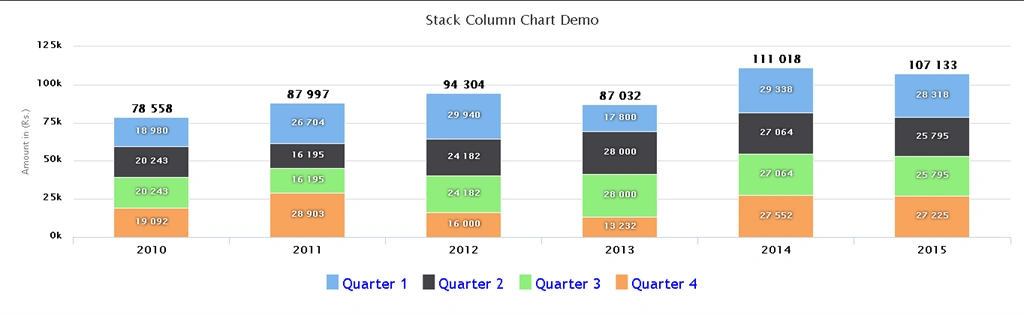
I hope you liked this article and understood how to bind a Stack Column Chart in ASP.NET using jQuery Ajax.
Ashish UpadhyayPosted Feb 21, 2018, 8:05 PM
Thanks for sharing
Santhakumar MunuswamyPosted Sep 5, 2015, 4:09 AM
Thanks for nice share
Ankit BansalPosted Sep 4, 2015, 5:05 AM
thanks for sharing...
Rajeesh MenothPosted Sep 4, 2015, 1:58 AM
Good Explanation
RakeshPosted Sep 3, 2015, 1:33 PM
Nice one
Manas MohapatraPosted Sep 3, 2015, 1:16 PM
Good one..
Shridhar SharmaPosted Sep 3, 2015, 11:43 AM
nice share
Mohammed IbrahimPosted Sep 3, 2015, 11:39 AM
nice
Pankaj Kumar ChoudharyPosted Sep 3, 2015, 7:58 AM
Nice Explain Sir.........
Upendra Pratap ShahiPosted Sep 3, 2015, 7:34 AM
nice one sir...thanks for sharing
Karthikeyan KPosted Sep 3, 2015, 7:32 AM
Good one sir...Thanks for sharing