

Introduction
In this article, we will see how to use the Chart control in Windows Forms Applications. As we know Charts and Graphs make data easier to understand and interpret. A chart is used to present the data in a visual form.
In this article, we will see how to use the Chart control in Windows Forms Applications. As we know Charts and Graphs make data easier to understand and interpret. A chart is used to present the data in a visual form.
Let's Begin
Step 1
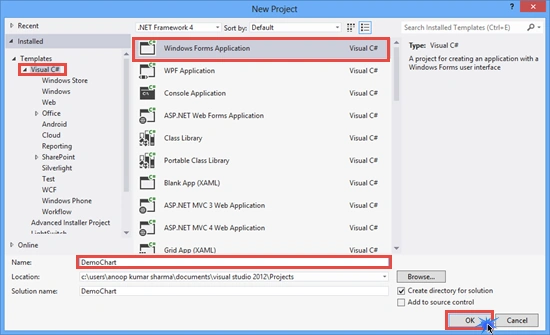
Open Visual Studio (I am using Visual Studio 2012) and create a new Windows Forms Application (select .NET Framework 4).
Open Visual Studio (I am using Visual Studio 2012) and create a new Windows Forms Application (select .NET Framework 4).
Step 2
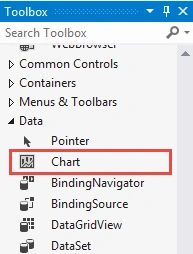
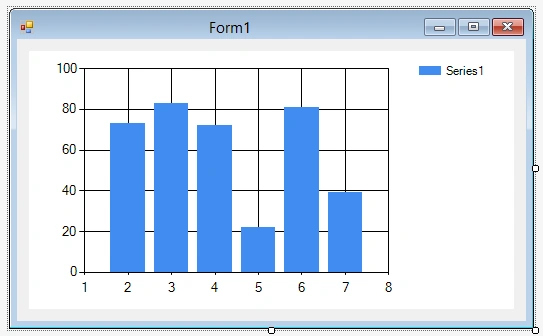
Drop a Chart control from the Toolbox present in the Data tab.
Drop a Chart control from the Toolbox present in the Data tab.
Step 3
Go to Chart properties then click on Series.
Go to Chart properties then click on Series.
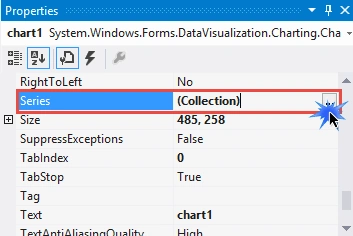
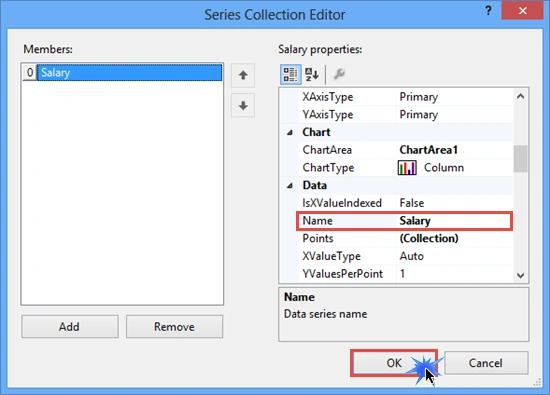
Change the name of Series. Here, I set the name to Salary. We can also change the ChartType as well as appearance from the Series Collection Editor.
Go to the Form1.cs code and add the following lines of code:
- using System;
- using System.Windows.Forms;
- namespace DemoChart
- {
- public partial class Form1 : Form
- {
- public Form1()
- {
- InitializeComponent();
- }
- private void Form1_Load(object sender, EventArgs e)
- {
- fillChart();
- }
- //fillChart method
- private void fillChart()
- {
- //AddXY value in chart1 in series named as Salary
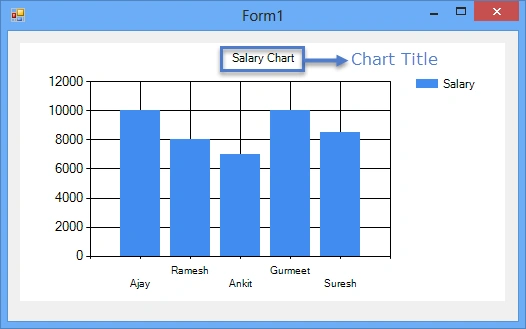
- chart1.Series["Salary"].Points.AddXY("Ajay", "10000");
- chart1.Series["Salary"].Points.AddXY("Ramesh", "8000");
- chart1.Series["Salary"].Points.AddXY("Ankit", "7000");
- chart1.Series["Salary"].Points.AddXY("Gurmeet", "10000");
- chart1.Series["Salary"].Points.AddXY("Suresh", "8500");
- //chart title
- chart1.Titles.Add("Salary Chart");
- }
- }
- }
Displaying Data in Chart control from the Database in Windows Forms Application
Step 1
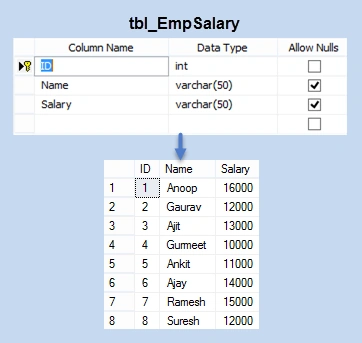
Create a database (named Sample). Add a Table tbl_EmpSalary. The following is the table schema for creating tbl_EmpSalary.
Create a database (named Sample). Add a Table tbl_EmpSalary. The following is the table schema for creating tbl_EmpSalary.
Use the following preceding procedure. Add these lines of code to Form1.cs:
- using System;
- using System.Windows.Forms;
- using System.Data;
- using System.Data.SqlClient;
- namespace DemoChart
- {
- public partial class Form1 : Form
- {
- public Form1()
- {
- InitializeComponent();
- }
- private void Form1_Load(object sender, EventArgs e)
- {
- fillChart();
- }
- //fillChart method
- private void fillChart()
- {
- SqlConnection con = new SqlConnection("Data Source=.;Initial Catalog=Sample;Integrated Security=true;");
- DataSet ds = new DataSet();
- con.Open();
- SqlDataAdapter adapt = new SqlDataAdapter("Select Name,Salary from tbl_EmpSalary", con);
- adapt.Fill(ds);
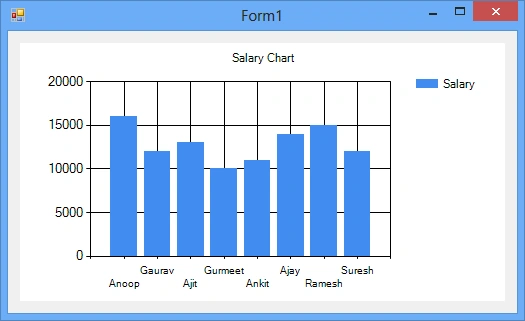
- chart1.DataSource = ds;
- //set the member of the chart data source used to data bind to the X-values of the series
- chart1.Series["Salary"].XValueMember = "Name";
- //set the member columns of the chart data source used to data bind to the X-values of the series
- chart1.Series["Salary"].YValueMembers = "Salary";
- chart1.Titles.Add("Salary Chart");
- con.Close();
- }
- }
- }
I hope you like it. Thanks.
Manikandan VaiyapuriPosted Mar 25, 2021, 9:15 AM
This is exactly what i was looking for. Thanks a lot Anoop. I have a question. Is it possible to use this Chart for plotting data in real time ? the range of X values are fixed. But the corresponding Y values keeps changing and this change should be captured in the chart in real time. Any suggestions would be highly appreciated. Once again thanks a lot for all your good work.
Pete DashwoodPosted Feb 15, 2021, 11:28 PM
I like this a lot. It is a simple, clear explanation and I found it very helpful. Many thanks, Anoop, for your post. All too often we see examples that are too cluttered and complex. This is great...
soni pPosted Dec 12, 2019, 1:53 AM
How can I create chart based on my database table & use a pen tool to draw different lines on the chart when required.
Tanmay NehetePosted Jun 11, 2018, 11:26 PM
I am having multiple columns in my datatable how to add that columns in chart
puran ahirPosted Jul 22, 2017, 2:05 AM
watch how to create chart in c# Https://youtu.be/4Hgs_pQn1xA
Aslal ShajaPosted Jul 14, 2017, 11:11 AM
How to get real time update based on sql database
allan asuncionPosted Mar 14, 2017, 11:56 PM
How to get data from database to chart using combo box category
Hardik PatelPosted Feb 2, 2017, 5:41 AM
How To View Actual Value In Column Chart
SubashPosted Dec 16, 2016, 2:47 AM
Very simple explanation useful share nice
Ritesh JhaPosted Jun 9, 2016, 2:11 AM
it is not useful for Visual Studio 2015 Comunity.....
Anoop Kumar SharmaPosted Mar 14, 2015, 4:59 AM
Thanks Gowtham Rajamanickam
Gowtham RajamanickamPosted Mar 14, 2015, 4:41 AM
nice one..
Anoop Kumar SharmaPosted Mar 9, 2015, 2:20 PM
Thanks Sourabh Somani :-)
Sourabh SomaniPosted Mar 9, 2015, 1:36 PM
nice one :)
Anoop Kumar SharmaPosted Mar 9, 2015, 1:29 PM
Silver Z You can set chart type at run time using this line of code. chart1.Series["Salary"].ChartType = SeriesChartType.Bar;
Anoop Kumar SharmaPosted Mar 9, 2015, 1:28 PM
Thanks Tom Mohan
Silver ZPosted Mar 9, 2015, 6:42 AM
how can we set chart type at run time.
Tom MohanPosted Mar 9, 2015, 1:42 AM
useful article