

Introduction
This article explains how to create a chart in an ASP.NET application. It's very easy to create the various types of charts in ASP.NET. In total there is around 35 types of charts supported by .NET 4.0. Use the following procedure to create a chart in your application.
For this application I am using the following table and Stored Procedure.
tblStudentInfo
- CREATE TABLE [dbo].[tblStudentInfo](
- [Id] [int] IDENTITY(1,1) NOT NULL,
- [Name] [varchar](50) NOT NULL,
- [Sub1] [int] NOT NULL,
- [Sub2] [int] NOT NULL,
- [Sub3] [int] NOT NULL,
- [Sub4] [int] NOT NULL,
- CONSTRAINT [PK_tblStudentInfo] PRIMARY KEY CLUSTERED
- (
- [Id] ASC
- )WITH (PAD_INDEX = OFF, STATISTICS_NORECOMPUTE = OFF, IGNORE_DUP_KEY = OFF, ALLOW_ROW_LOCKS = ON, ALLOW_PAGE_LOCKS = ON) ON [PRIMARY]
- ) ON [PRIMARY]
And the Stored Procedure SpStudentInfo calculates the student's sum of their marks that I will display in the chart.
- USE [manishDB]
- GO
- /****** Object: StoredProcedure [dbo].[SelectAllStudent] Script Date: 11/26/2014 22:26:13 ******/
- SET ANSI_NULLS ON
- GO
- SET QUOTED_IDENTIFIER ON
- GO
- Create PROCEDURE [dbo].[SpStudentInfo]
- AS
- Begin
- select Top 10 Name,Sub1 +Sub2 +Sub3 +Sub4 "Total Marks"
- from tblStudentInfo
- End
- using System.Web.UI.DataVisualization.Charting;
Open Visual Studio and create a new web application. Drag and drop a Chart from the toolbar.
*chart
Step 2
Go to the property of that control and set it as shown in the following code.
- <asp:Chart ID="Chart1" runat="server" Height="300px" Width="400px">
- <Titles>
- <asp:Title ShadowOffset="3" Name="Items" />
- </Titles>
- <Legends>
- <asp:Legend Alignment="Center" Docking="Bottom" IsTextAutoFit="False" Name="Default" LegendStyle="Row" />
- </Legends>
- <Series>
- <asp:Series Name="Default" />
- </Series>
- <ChartAreas>
- <asp:ChartArea Name="ChartArea1" BorderWidth="0" />
- </ChartAreas>
- </asp:Chart>
Now create a class that will communicate with the database and call the Stored Procedure for displaying the chart.
- public class Configuration
- {
- internal static string connectionString = ConfigurationManager.ConnectionStrings["DbCS"].ConnectionString;
- }
- public class DbOperation
- {
- private void selectData(string StoredProcedureName, out DataTable dtemp, [Optional] string[,] aryParameters)
- {
- using (SqlConnection con = new SqlConnection(Configuration.connectionString))
- {
- using (SqlCommand cmd = new SqlCommand())
- {
- con.Open();
- cmd.CommandType = CommandType.StoredProcedure;
- SqlDataAdapter adp = new SqlDataAdapter();
- DataTable dt = new DataTable();
- cmd.CommandText = StoredProcedureName;
- cmd.CommandTimeout = 300;
- try
- {
- for (int i = 0; i < aryParameters.GetLength(0); i++)
- {
- cmd.Parameters.Add(new SqlParameter(aryParameters[i, 0], aryParameters[i, 1]));
- }
- }
- catch (Exception ex)
- {
- }
- cmd.Connection = con;
- adp.SelectCommand = cmd;
- adp.Fill(dt);
- con.Close();
- dtemp = dt;
- }
- }
- }
- public DataTable MarksDetails()
- {
- DataTable dt = new DataTable();
- selectData("SpStudentInfo", out dt, null);
- return dt;
- }
- }
After creating the preceding class go to the design mode of the web form and create the following function.
- private void DisplayChart(SeriesChartType cType)
- {
- DataTable dt = new DataTable();
- DbOperation db = new DbOperation();
- dt = db.MarksDetails();
- string[] x = new string[dt.Rows.Count];
- int[] y = new int[dt.Rows.Count];
- for (int i = 0; i < dt.Rows.Count; i++)
- {
- x[i] = dt.Rows[i]["Name"].ToString();
- y[i] = Convert.ToInt32(dt.Rows[i]["Total Marks"]);
- }
- Chart1.Series[0].Points.DataBindXY(x, y);
- Chart1.Series[0].ChartType = cType;
- Chart1.ChartAreas["ChartArea1"].Area3DStyle.Enable3D = true;
- Chart1.Legends[0].Enabled = true;
- }
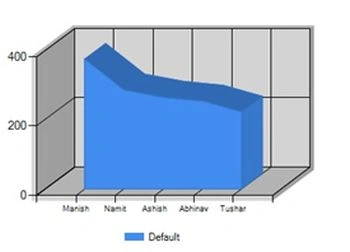
After this call that function in the form load by passing the chart type you need.
- // For Area Chart
- SeriesChartType type = SeriesChartType.Area;
- DisplayChart(type);
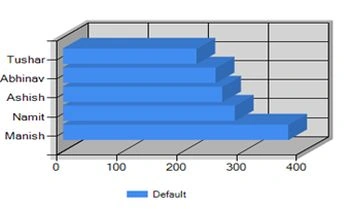
- // For Bar Chart
- SeriesChartType type = SeriesChartType. Bar;
- DisplayChart(type);
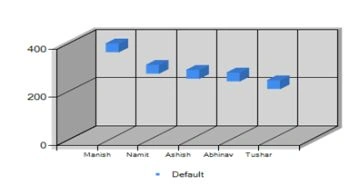
- // For Bubble Chart
- SeriesChartType type = SeriesChartType. Bubble;
- DisplayChart(type);
In the same way just change the SeriesChartType and display the different design of chart.
For a better understanding of this download the source code attached with this article.
Summary
In this illustration you came to understand how to create various types of charts in ASP.NET.
Manish Kumar ChoudharyPosted Dec 4, 2014, 2:19 PM
Thanks Anoop Kumar Sharma sir....
Anoop Kumar SharmaPosted Dec 4, 2014, 1:43 PM
Nice Article Manish Kumar Choudhary
Manish Kumar ChoudharyPosted Dec 4, 2014, 6:58 AM
Thanks Sumit Jolly sir..
Guest UserPosted Dec 4, 2014, 6:57 AM
it's by asp.net using web forms. if you want to use using JS libraries, highchart, D3, NVD3 are the ones you can look at. But good job!
Manish Kumar ChoudharyPosted Nov 28, 2014, 3:50 AM
Thanks venkat kumar sir..
Venkat KumarPosted Nov 28, 2014, 3:32 AM
nice article and you explained very well
Manish Kumar ChoudharyPosted Nov 27, 2014, 11:04 PM
Thanks Deepak Verma sir.. agreed.
Deepak VermaPosted Nov 27, 2014, 10:56 PM
Good demonstration.... but asp.net charts are slow. It's good to go with Google Charts + Web Service/WCF. Or any other Client-side charting solution.
Manish Kumar ChoudharyPosted Nov 27, 2014, 10:54 PM
Thanks Jeetendra Gund sir..
Jeetendra GundPosted Nov 27, 2014, 7:40 AM
Good explanation
Manish Kumar ChoudharyPosted Nov 27, 2014, 7:16 AM
Thanks Vithal Wadje sir..
Vithal WadjePosted Nov 27, 2014, 7:15 AM
just awesome..thanks for sharing