

Introduction
In this article, I will walk through how to create a Line Chart using HTML5 canvas.
What is a Line Chart?
A line chart is a style of chart that is created by connecting a series of data points together with a line. It is used to display information in a series of data points connected by straight-line segments. It enables us to find trends (or patterns) over time.
Use of the Line Chart
A line graph is used to represent a set of data values in which a quantity varies with time. We can use a line chart to show how the stock value for a certain company develops over time on the stock market. We can also use it for representing temperature, sales, employment, company profit, or cost over a period of time.
The figure given below represents how to create a line series with symbols in HTML5.
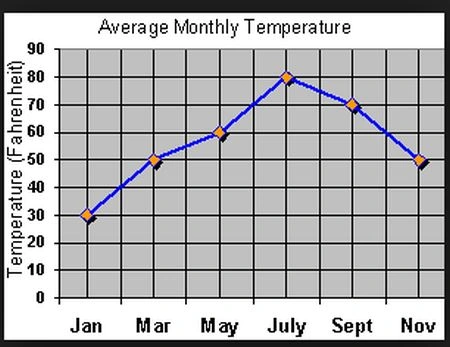
Figure 1
Browser Support
It is supported by all major browsers such as Internet Explorer 9, Firefox 3.6+, Safari 4+ Chrome, etc.
Procedure for creating the Line Graph
Step 1. We first define the element using HTML5 canvas. The height and width attributes set the canvas and graph size.
<canvas id="myCanvas" width="600" height="300" style="border: 1px solid black;"></canvas>
Step 2. In order to interact with this canvas through JavaScript, we will need to first get the element by ID and then create a context.
<script type="text/javascript">
    var canvas = document.getElementById('mycanvas');
    var ctx = canvas.getContext("2d");
</script>
Step 3. In the following step, we will create a "LineChart()" function in which we define various methods, variables, constants, and properties. In this step, we will draw both the X-axis and Y-axis.
function LineChart(con) {
    // user defined properties
    this.canvas = document.getElementById(con.canvasId);
    this.minX = con.minX;
    this.minY = con.minY;
    this.maxX = con.maxX;
    this.maxY = con.maxY;
    this.unitsPerTickX = con.unitsPerTickX;
    this.unitsPerTickY = con.unitsPerTickY;

    // constants
    this.padding = 10;
    this.tickSize = 10;
    this.axisColor = "#555";
    this.pointRadius = 5;
    this.font = "12pt Calibri";

    this.fontHeight = 12;

    // relationships
    this.context = this.canvas.getContext("2d");
    this.rangeX = this.maxX - this.minY;
    this.rangeY = this.maxY - this.minY;
    this.numXTicks = Math.round(this.rangeX / this.unitsPerTickX);
    this.numYTicks = Math.round(this.rangeY / this.unitsPerTickY);
    this.x = this.getLongestValueWidth() + this.padding * 2;
    this.y = this.padding * 2;
    this.width = this.canvas.width - this.x - this.padding * 2;
    this.height = this.canvas.height - this.y - this.padding - this.fontHeight;
    this.scaleX = this.width / this.rangeX;
    this.scaleY = this.height / this.rangeY;

    // draw x y axis and tick marks
    this.drawXAxis();
    this.drawYAxis();
}
Step 4. In the following step, we will get the value of the longest width of the following Line Graph or chart. For finding the longest value we apply the loop that will return the longest Value Width.
LineChart.prototype.getLongestValueWidth = function () {
    this.context.font = this.font;
    var longestValueWidth = 0;
    for (var n = 0; n <= this.numYTicks; n++) {
        var value = this.maxY - (n * this.unitsPerTickY);
        longestValueWidth = Math.max(longestValueWidth, this.context.measureText(value).width);
    }
    return longestValueWidth;
};
Step 5. In this step, we will draw the line chart along the x-axis. We also draw the tick marks along the x-axis and finally, in this step, we draw the x-axis labels. For drawing both the tick marks and labels we apply the loop.
LineChart.prototype.drawXAxis = function () {
    var context = this.context;
    context.save();
    context.beginPath();
    context.moveTo(this.x, this.y + this.height);
    context.lineTo(this.x + this.width, this.y + this.height);
    context.strokeStyle = this.axisColor;
    context.lineWidth = 2;
    context.stroke();

    // draw tick marks
    for (var n = 0; n < this.numXTicks; n++) {
        context.beginPath();
        context.moveTo((n + 1) * this.width / this.numXTicks + this.x, this.y + this.height);
        context.lineTo((n + 1) * this.width / this.numXTicks + this.x, this.y + this.height - this.tickSize);
        context.stroke();
    }
};
This figure represents a tick mark along the x-axis shown below.

Figure 2
// draw labels
context.font = this.font;
context.fillStyle = "black";
context.textAlign = "center";
context.textBaseline = "middle";

for (var n = 0; n < this.numXTicks; n++) {
    var label = Math.round((n + 1) * this.maxX / this.numXTicks);
    context.save();
    context.translate((n + 1) * this.width / this.numXTicks + this.x, this.y + this.height + this.padding);
    context.fillText(label, 0, 0);
    context.restore();
}
context.restore();
This figure represents labels along the x-axis.

Figure 3
Step 6. Similarly, we will draw the line chart along the y-axis. We also draw the tick marks along the y-axis and finally, in this step, we draw the y-axis labels. For drawing both of the tick marks and labels we apply the loop.
LineChart.prototype.drawYAxis = function () {
    var context = this.context;
    context.save();
    context.save();
    context.beginPath();
    context.moveTo(this.x, this.y);
    context.lineTo(this.x, this.y + this.height);
    context.strokeStyle = this.axisColor;
    context.lineWidth = 2;
    context.stroke();
    context.restore();

    // draw tick marks
    for (var n = 0; n < this.numYTicks; n++) {
        context.beginPath();
        context.moveTo(this.x, n * this.height / this.numYTicks + this.y);
        context.lineTo(this.x + this.tickSize, n * this.height / this.numYTicks + this.y);
        context.stroke();
    }
}
This figure shows the tick mark along the y-axis.

Figure 4
// draw values
context.font = this.font;
context.fillStyle = "black";
context.textAlign = "right";
context.textBaseline = "middle";

for (var n = 0; n < this.numYTicks; n++) {
    var value = Math.round(this.maxY - n * this.maxY / this.numYTicks);
    context.save();
    context.translate(this.x - this.padding, n * this.height / this.numYTicks + this.y);
    context.fillText(value, 0, 0);
    context.restore();
}
context.restore();
};
This figure represents labels along the y-axis as shown.

Figure 5
This figure shows when the x-axis and y-axis are joined together.
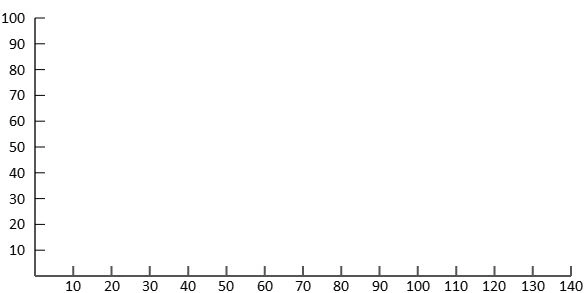
Figure 6
Step 7. In the following step, we will draw the line. We will also describe the width and color of the line. Once the labels and lines are rendered, CanvasChart handles rendering the data points.
LineChart.prototype.drawLine = function (data, color, width) {
    var context = this.context;
    context.save();
    this.transformContext();
    context.lineWidth = width;
    context.strokeStyle = color;
    context.fillStyle = color;
    context.beginPath();
    context.moveTo(data[0].x * this.scaleX, data[0].y * this.scaleY);

    for (var n = 0; n < data.length; n++) {
        var point = data[n];

        // draw segment
        context.lineTo(point.x * this.scaleX, point.y * this.scaleY);
        context.stroke();
        context.closePath();
        context.beginPath();
        context.arc(point.x * this.scaleX, point.y * this.scaleY, this.pointRadius, 0, 2 * Math.PI, false);
        context.fill();
        context.closePath();

        // position for next segment
        context.beginPath();
        context.moveTo(point.x * this.scaleX, point.y * this.scaleY);
    }
    context.restore();
};
Step 8. In the following step, we will transform the context and move the context to the center.
LineChart.prototype.transformContext = function () {
    var context = this.context;

    // move context to center of canvas
    this.context.translate(this.x, this.y + this.height);

    // invert the y scale so that that increments
    // as you move upwards
    context.scale(1, -1);
};
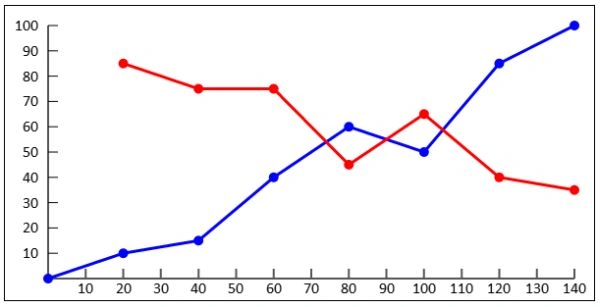
Step 9. In the following step, a window on the load we will call the "drawing ()" method that will draw a line based on the following points that are placed on the graph.
window.onload = function () {
    var myLineChart = new LineChart({
        canvasId: "myCanvas",
        minX: 0,
        minY: 0,
        maxX: 140,
        maxY: 100,
        unitsPerTickX: 10,
        unitsPerTickY: 10
    });

    var data = [{
        x: 0,
        y: 0
    }, {
        x: 20,
        y: 10
    }, {
        x: 40,
        y: 15
    }, {
        x: 60,
        y: 40
    }, {
        x: 80,
        y: 60
    }, {
        x: 100,
        y: 50
    }, {
        x: 120,
        y: 85
    }, {
        x: 140,
        y: 100
    }];

    myLineChart.drawLine(data, "blue", 3);

    var data = [{
        x: 20,
        y: 85
    }, {
        x: 40,
        y: 75
    }, {
        x: 60,
        y: 75
    }, {
        x: 80,
        y: 45
    }, {
        x: 100,
        y: 65
    }, {
        x: 120,
        y: 40
    }, {
        x: 140,
        y: 35
    }];

    myLineChart.drawLine(data, "red", 3);
};
Example
<!DOCTYPE html>
<html lang="en" xmlns="http://www.w3.org/1999/xhtml">
<head>
    <meta charset="utf-8" />
    <title>Line Chart in HTML5</title>
    <script>
        function LineChart(con) {
            // user defined properties
            this.canvas = document.getElementById(con.canvasId);
            this.minX = con.minX;
            this.minY = con.minY;
            this.maxX = con.maxX;
            this.maxY = con.maxY;
            this.unitsPerTickX = con.unitsPerTickX;
            this.unitsPerTickY = con.unitsPerTickY;

            // constants
            this.padding = 10;
            this.tickSize = 10;
            this.axisColor = "#555";
            this.pointRadius = 5;
            this.font = "12pt Calibri";

            this.fontHeight = 12;

            // relationships
            this.context = this.canvas.getContext("2d");
            this.rangeX = this.maxX - this.minY;
            this.rangeY = this.maxY - this.minY;
            this.numXTicks = Math.round(this.rangeX / this.unitsPerTickX);
            this.numYTicks = Math.round(this.rangeY / this.unitsPerTickY);
            this.x = this.getLongestValueWidth() + this.padding * 2;
            this.y = this.padding * 2;
            this.width = this.canvas.width - this.x - this.padding * 2;
            this.height = this.canvas.height - this.y - this.padding - this.fontHeight;
            this.scaleX = this.width / this.rangeX;
            this.scaleY = this.height / this.rangeY;

            // draw x y axis and tick marks
            this.drawXAxis();
            this.drawYAxis();
        }

        LineChart.prototype.getLongestValueWidth = function () {
            this.context.font = this.font;
            var longestValueWidth = 0;
            for (var n = 0; n <= this.numYTicks; n++) {
                var value = this.maxY - (n * this.unitsPerTickY);
                longestValueWidth = Math.max(longestValueWidth, this.context.measureText(value).width);
            }
            return longestValueWidth;
        };

        LineChart.prototype.drawXAxis = function () {
            var context = this.context;
            context.save();
            context.beginPath();
            context.moveTo(this.x, this.y + this.height);
            context.lineTo(this.x + this.width, this.y + this.height);
            context.strokeStyle = this.axisColor;
            context.lineWidth = 2;
            context.stroke();

            // draw tick marks
            for (var n = 0; n < this.numXTicks; n++) {
                context.beginPath();
                context.moveTo((n + 1) * this.width / this.numXTicks + this.x, this.y + this.height);
                context.lineTo((n + 1) * this.width / this.numXTicks + this.x, this.y + this.height - this.tickSize);
                context.stroke();
            }

            // draw labels
            context.font = this.font;
            context.fillStyle = "black";
            context.textAlign = "center";
            context.textBaseline = "middle";

            for (var n = 0; n < this.numXTicks; n++) {
                var label = Math.round((n + 1) * this.maxX / this.numXTicks);
                context.save();
                context.translate((n + 1) * this.width / this.numXTicks + this.x, this.y + this.height + this.padding);
                context.fillText(label, 0, 0);
                context.restore();
            }
            context.restore();
        };

        LineChart.prototype.drawYAxis = function () {
            var context = this.context;
            context.save();
            context.save();
            context.beginPath();
            context.moveTo(this.x, this.y);
            context.lineTo(this.x, this.y + this.height);
            context.strokeStyle = this.axisColor;
            context.lineWidth = 2;
            context.stroke();
            context.restore();

            // draw tick marks
            for (var n = 0; n < this.numYTicks; n++) {
                context.beginPath();
                context.moveTo(this.x, n * this.height / this.numYTicks + this.y);
                context.lineTo(this.x + this.tickSize, n * this.height / this.numYTicks + this.y);
                context.stroke();
            }

            // draw values
            context.font = this.font;
            context.fillStyle = "black";
            context.textAlign = "right";
            context.textBaseline = "middle";

            for (var n = 0; n < this.numYTicks; n++) {
                var value = Math.round(this.maxY - n * this.maxY / this.numYTicks);
                context.save();
                context.translate(this.x - this.padding, n * this.height / this.numYTicks + this.y);
                context.fillText(value, 0, 0);
                context.restore();
            }
            context.restore();
        };

        LineChart.prototype.drawLine = function (data, color, width) {
            var context = this.context;
            context.save();
            this.transformContext();
            context.lineWidth = width;
            context.strokeStyle = color;
            context.fillStyle = color;
            context.beginPath();
            context.moveTo(data[0].x * this.scaleX, data[0].y * this.scaleY);

            for (var n = 0; n < data.length; n++) {
                var point = data[n];

                // draw segment
                context.lineTo(point.x * this.scaleX, point.y * this.scaleY);
                context.stroke();
                context.closePath();
                context.beginPath();
                context.arc(point.x * this.scaleX, point.y * this.scaleY, this.pointRadius, 0, 2 * Math.PI, false);
                context.fill();
                context.closePath();

                // position for next segment
                context.beginPath();
                context.moveTo(point.x * this.scaleX, point.y * this.scaleY);
            }
            context.restore();
        };

        LineChart.prototype.transformContext = function () {
            var context = this.context;

            // move context to center of canvas
            this.context.translate(this.x, this.y + this.height);

            // invert the y scale so that that increments
            // as you move upwards
            context.scale(1, -1);
        };

        window.onload = function () {
            var myLineChart = new LineChart({
                canvasId: "myCanvas",
                minX: 0,
                minY: 0,
                maxX: 140,
                maxY: 100,
                unitsPerTickX: 10,
                unitsPerTickY: 10
            });

            var data = [{
                x: 0,
                y: 0
            }, {
                x: 20,
                y: 10
            }, {
                x: 40,
                y: 15
            }, {
                x: 60,
                y: 40
            }, {
                x: 80,
                y: 60
            }, {
                x: 100,
                y: 50
            }, {
                x: 120,
                y: 85
            }, {
                x: 140,
                y: 100
            }];

            myLineChart.drawLine(data, "blue", 3);

            var data = [{
                x: 20,
                y: 85
            }, {
                x: 40,
                y: 75
            }, {
                x: 60,
                y: 75
            }, {
                x: 80,
                y: 45
            }, {
                x: 100,
                y: 65
            }, {
                x: 120,
                y: 40
            }, {
                x: 140,
                y: 35
            }];

            myLineChart.drawLine(data, "red", 3);
        };
    </script>
</head>
<body>
    <canvas id="myCanvas" width="600" height="300" style="border: 1px solid black;"></canvas>
</body>
</html>
Output
Fran DUTPosted Jul 18, 2017, 1:16 PM
Ok. No answer, why ?
Fran DUTPosted Jul 17, 2017, 9:22 AM
Sorry, I am french
Fran DUTPosted Jul 17, 2017, 9:21 AM
Excellent script, but minX don't works, as minY which are staying on 0.
Fran DUTPosted Jul 17, 2017, 9:14 AM
Good job, Negative minX or minY don't works. Why ?
Bhuvana PPosted Jul 3, 2017, 7:28 AM
Tutorial was very helpful. I am looking for label position in x and y axis. can you please share idea
Vitor LoryPosted Jun 4, 2017, 1:00 PM
Fantastic work Ashwani. I was looking for something like this and you really help me.I made a few changes on the line drawing and axis labelling so that the minimum X and Y had a cropping behaviour, and now I have a great line chart tool. I can share my changed code, if you are interested.
Divya CPosted Mar 20, 2017, 1:13 AM
Can we draw multiple graph (both bar and line on y axis) using this html5 canvas?
bharti karnPosted Apr 15, 2013, 12:06 PM
very clear code....