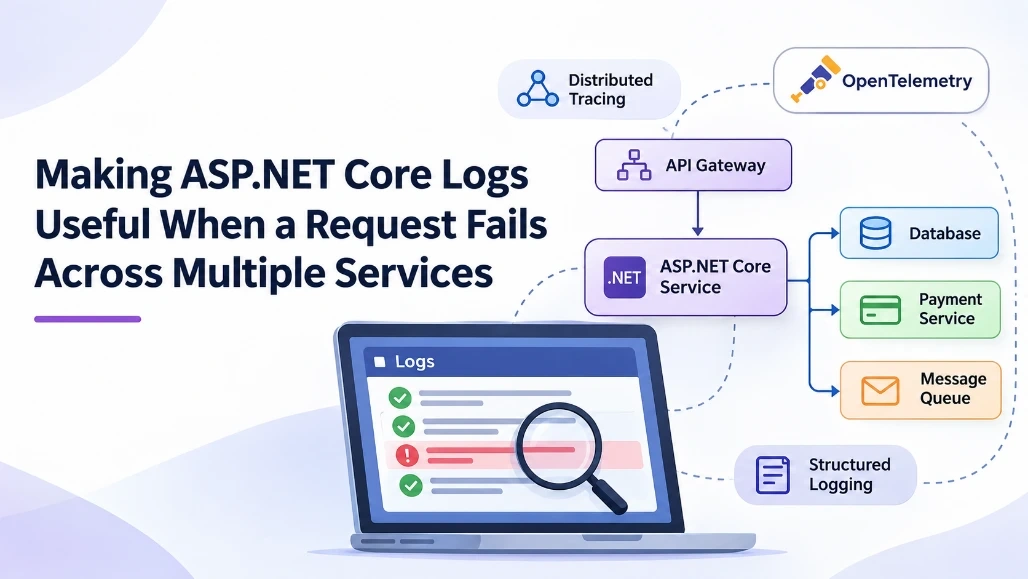
When an ASP.NET Core application runs as a single service, investigating a failed request is relatively straightforward. A developer can inspect the application logs, identify the exception, and trace the execution path to understand what went wrong.
The situation becomes more complicated when an application depends on multiple services. A single request might enter an API gateway, pass through an ASP.NET Core application, retrieve information from a database, call an external payment service, and publish a message to a background processing system. If the final operation fails, the error may originate from any of these components.
Consider an e-commerce application where a customer places an order. The API receives the request, validates the customer, checks inventory, calculates the total amount, processes payment, and saves the order. Suppose the payment service responds successfully, but the database operation fails while saving the order. The customer receives an error, but the application may already have completed part of the operation.
Looking at the final exception alone does not explain the complete sequence of events. Developers need to understand which services were called, how long each operation took, which component returned an error, and whether an earlier operation had already completed.
This is where structured logging and distributed tracing become important.
ASP.NET Core provides a built-in logging abstraction through ILogger<T>, while .NET also supports distributed tracing through Activity and the OpenTelemetry ecosystem. When these capabilities are configured correctly, logs become more than a collection of error messages. They become useful diagnostic records that help developers reconstruct what happened across application boundaries.
Why Traditional Application Logs Are Not Enough
Many applications begin with simple logging statements:
_logger.LogInformation("Order request received");

_logger.LogError("Unable to process order");
These messages are useful during development, but they provide very little information when investigating production failures.
Imagine that three customers report that order creation is failing. The application logs contain hundreds of messages saying that an order request was received, but none of them clearly identifies which messages belong to the same request.
Developers may try to correlate events using timestamps, usernames, or request URLs. This approach becomes unreliable when multiple requests are processed simultaneously. Two customers can place orders within milliseconds of each other, and several services may write logs independently.
There are three major problems with this style of logging.
First, the messages do not contain enough context. A message such as Payment failed does not tell the developer which payment provider was contacted, which operation failed, or whether the failure was caused by a timeout, an authentication problem, or a business validation rule.
Second, the logs do not share a consistent identifier. Without a correlation mechanism, connecting events from the API, payment service, and database becomes difficult.
Third, logging often focuses only on failures. Successful operations are also important because they establish what happened before the failure. If payment processing completed successfully but order persistence failed, that distinction matters when diagnosing the incident.
A useful logging strategy should capture the important stages of a request while keeping sensitive information out of the logs.
Use ILogger With Structured Logging
ASP.NET Core applications commonly use ILogger<T> for application logging. The interface provides different log levels and allows developers to include structured properties with each message.
Consider an order service that processes a request:
public class OrderService
{
    private readonly ILogger<OrderService> _logger;

    public OrderService(ILogger<OrderService> logger)
    {
        _logger = logger;
    }

    public async Task ProcessOrderAsync(
        int orderId,
        CancellationToken cancellationToken)
    {
        _logger.LogInformation(
            "Starting order processing for {OrderId}",
            orderId);

        try
        {
            await SaveOrderAsync(
                orderId,
                cancellationToken);

            _logger.LogInformation(
                "Order processing completed for {OrderId}",
                orderId);
        }
        catch (Exception ex)
        {
            _logger.LogError(
                ex,
                "Order processing failed for {OrderId}",
                orderId);

            throw;
        }
    }

    private Task SaveOrderAsync(
        int orderId,
        CancellationToken cancellationToken)
    {
        // Database operation
        return Task.CompletedTask;
    }
}
The important difference is the use of named properties such as {OrderId} instead of constructing the entire message through string interpolation.
Structured logging preserves the order ID as a separate property. A logging provider can store it as a searchable field, allowing developers to filter events by order ID without searching through the complete message text.
For example, a log entry might contain:
{
  "level": "Information",
  "message": "Starting order processing for 10542",
  "OrderId": 10542,
  "category": "OrderService"
}
The actual JSON structure depends on the logging provider and its configuration, but the principle remains the same: important diagnostic values should be recorded as structured properties.
This becomes especially useful when a logging platform supports filtering, aggregation, and dashboards. Developers can search for a specific order, compare processing durations, and identify repeated failures without manually reading every log entry.
Understand the Different Log Levels
Not every event deserves the same level of attention. ASP.NET Core provides standard logging levels that help teams distinguish normal application activity from unexpected behavior.
Log level | When to use it | Example |
|---|
Trace | Very detailed diagnostic information | Internal processing details |
Debug | Information useful during development and investigation | Selected configuration decisions |
Information | Normal application operations | Order successfully created |
Warning | Unexpected situations that do not necessarily stop processing | External service retry |
Error | An operation failed | Database save failed |
Critical | A failure affecting the application or an essential service | Application cannot connect to its required database |
A common mistake is logging every exception as an error. Some exceptions are part of normal application behavior. For example, a client disconnecting during a request does not always indicate an application defect.
Similarly, a temporary external service failure may be logged as a warning when the application successfully retries the operation.
Choosing the correct log level improves monitoring quality. If every event is recorded as an error, important failures become harder to distinguish from expected operational conditions.
Correlate Logs Across Multiple Services
The next challenge is connecting logs generated by different services.
ASP.NET Core supports request-level correlation through Activity and diagnostic context. When distributed tracing is enabled, an incoming request can have a trace identifier that is propagated to downstream operations.
For example, an order request might follow this sequence:
Client Request
      |
      v
Order API
      |
      +------ Inventory Service
      |
      +------ Payment Service
      |
      +------ Database
      |
      v
Order Response
Each service can generate its own logs, but all operations should be associated with the same distributed trace.
A trace ID identifies the overall operation, while a span ID identifies an individual operation within that trace.
For example:
{
  "service": "order-api",
  "traceId": "4bf92f3577b34da6a3ce929d0e0e4736",
  "spanId": "00f067aa0ba902b7",
  "message": "Starting order processing"
}
The payment service may produce another record with the same trace ID but a different span ID.
This allows a tracing platform to reconstruct the request path and show how much time was spent in each service.
.NET uses the Activity API to represent these operations. ASP.NET Core automatically creates activities for incoming HTTP requests when diagnostic instrumentation is enabled. Supported HTTP client instrumentation can create activities for outgoing requests as well.
For a custom operation, developers can create an activity explicitly:
using System.Diagnostics;

public class OrderService
{
    private static readonly ActivitySource ActivitySource =
        new("OrderService");

    private readonly ILogger<OrderService> _logger;

    public OrderService(ILogger<OrderService> logger)
    {
        _logger = logger;
    }

    public async Task ProcessOrderAsync(
        int orderId,
        CancellationToken cancellationToken)
    {
        using var activity = ActivitySource.StartActivity(
            "ProcessOrder");

        activity?.SetTag("order.id", orderId);

        _logger.LogInformation(
            "Processing order {OrderId}",
            orderId);

        await Task.Delay(100, cancellationToken);
    }
}
The ActivitySource represents the component producing tracing information. The activity records the operation and can include useful attributes such as the order ID.
The activity is disposed when processing finishes, which ends the operation and allows the tracing infrastructure to record its duration.
However, creating an ActivitySource does not automatically export traces to a monitoring platform. The application needs a configured listener or tracing provider, such as OpenTelemetry, to collect and export the activity data.
Add OpenTelemetry for Distributed Observability
For applications that communicate with multiple services, OpenTelemetry provides a standard approach to collecting traces, metrics, and logs.
The .NET OpenTelemetry ecosystem supports instrumentation for ASP.NET Core, HTTP clients, and other application components. Developers can combine automatic instrumentation with custom activities to understand both framework-level operations and application-specific business workflows.
A typical ASP.NET Core application can configure tracing in Program.cs:
using OpenTelemetry.Resources;
using OpenTelemetry.Trace;

var builder = WebApplication.CreateBuilder(args);

builder.Services.AddOpenTelemetry()
    .ConfigureResource(resource =>
        resource.AddService("OrderApi"))
    .WithTracing(tracing =>
    {
        tracing
            .AddAspNetCoreInstrumentation()
            .AddHttpClientInstrumentation()
            .AddSource("OrderService");
    });

builder.Services.AddControllers();

var app = builder.Build();

app.MapControllers();

app.Run();
This configuration registers tracing for incoming ASP.NET Core requests, outgoing HTTP client calls, and custom activities created through the OrderService activity source.
An exporter must also be configured to send the collected telemetry to an observability backend. The appropriate exporter depends on the monitoring platform used by the organization.
For example, an OpenTelemetry Protocol exporter can send traces to a collector, which can then forward the data to a compatible tracing backend.
The advantage of this approach is that application code does not need to manually create correlation identifiers for every downstream request. Supported instrumentation handles propagation automatically when the required context is available.
For services that communicate through message queues, developers may need additional instrumentation to propagate trace context through message headers. HTTP propagation alone does not cover every asynchronous communication pattern.
Propagate Correlation Context to Downstream Services
A distributed trace is useful only when its context can move between services.
For HTTP communication, the W3C Trace Context standard defines headers such as traceparent and tracestate. These headers allow supported services to continue an existing trace rather than starting an unrelated one.
A typical traceparent header looks like this:
traceparent: 00-4bf92f3577b34da6a3ce929d0e0e4736-00f067aa0ba902b7-01
It contains the trace ID, parent span ID, and trace flags.
When an ASP.NET Core application receives a request containing valid trace context, the tracing infrastructure can continue the existing trace. When the application calls another instrumented service, the context can be propagated through the outgoing request.
For example, an order API might call a payment service using HttpClient:
public class PaymentClient
{
    private readonly HttpClient _httpClient;

    public PaymentClient(HttpClient httpClient)
    {
        _httpClient = httpClient;
    }

    public async Task ProcessPaymentAsync(
        CancellationToken cancellationToken)
    {
        using var response = await _httpClient.PostAsync(
            "/payments",
            content: null,
            cancellationToken);

        response.EnsureSuccessStatusCode();
    }
}
When HTTP client tracing and standard context propagation are configured, the outgoing request can carry the trace context automatically.
Avoid manually generating a new trace ID for every downstream call. Doing so breaks the relationship between the parent request and its child operations.
Also, do not blindly trust externally supplied correlation headers for security decisions. Trace context is useful for observability, but it is not an authentication mechanism.
Capture Exceptions With Enough Diagnostic Context
When a request fails, the exception itself is only part of the information needed to investigate the problem.
Developers should also record the operation being performed, relevant business identifiers, the affected dependency, and the outcome of the operation.
Consider a payment operation:
public async Task ProcessPaymentAsync(
    int orderId,
    CancellationToken cancellationToken)
{
    try
    {
        await _paymentClient.ProcessAsync(
            orderId,
            cancellationToken);

        _logger.LogInformation(
            "Payment completed for order {OrderId}",
            orderId);
    }
    catch (HttpRequestException ex)
    {
        _logger.LogError(
            ex,
            "Payment service communication failed for order {OrderId}",
            orderId);

        throw;
    }
}
This log provides more useful information than a generic message such as Payment failed. It identifies the operation and the business entity involved while preserving the exception details for diagnostics.
However, avoid logging complete payment requests, authorization headers, customer passwords, access tokens, or card information. Structured logging does not make sensitive information safe merely because it is stored in separate fields.
A good production logging policy should define which business identifiers can be recorded and which values must be masked or excluded.
Make Logs Useful Without Creating Too Much Noise
Adding more logging does not automatically improve observability. Excessive logging can increase storage costs, make dashboards difficult to interpret, and introduce performance overhead.
For example, logging every item in a large order can generate thousands of records for a single request. In most cases, a single structured event containing the order ID, item count, processing duration, and result is more useful.
Use logs for discrete events and important decisions. Use traces to understand the path and duration of an operation. Use metrics to monitor trends such as request rates, failure percentages, and latency distributions.
These three signals complement one another.
A metric might reveal that payment requests are experiencing increased latency. A distributed trace can show that the payment service is responsible for most of the delay. Logs can then provide the detailed error message or business context needed to understand why the operation failed.
This is a more effective diagnostic process than relying on a large collection of unstructured log statements.
Common Mistakes in ASP.NET Core Logging
One common mistake is using string interpolation for every log message:
_logger.LogInformation(
    $"Order {orderId} processed successfully");
Although this produces readable output, it constructs the message before passing it to the logging provider. Structured templates are preferable because they preserve named properties and allow providers to filter and aggregate events more effectively.
Another mistake is generating a new correlation ID inside every service. This disconnects related operations and makes distributed tracing less useful. Use the existing trace context and allow supported instrumentation to propagate it.
Teams also sometimes log exceptions without including the exception object:
_logger.LogError(
    "Database operation failed");
This loses important diagnostic information such as the exception type and stack trace. When appropriate, pass the exception as the first argument to the logging method.
Finally, avoid treating logs as a replacement for metrics and tracing. Logs explain individual events, but they are not the most efficient way to understand the overall performance of a distributed application.
Best Practices for Production Applications
A production logging strategy should start with consistent structured logging across services. Use meaningful property names, standard log levels, and a shared approach to identifying requests and business operations.
Enable distributed tracing for incoming requests and outgoing HTTP calls. Use custom activities for important operations that are not covered by automatic instrumentation. Ensure that trace context is propagated through message queues and background processing where appropriate.
Define a clear policy for sensitive information. Avoid recording passwords, access tokens, authorization headers, payment details, and other confidential values. Apply the same rules to exception messages and diagnostic context.
Also, establish retention policies and access controls for centralized logs. Production logs can contain operational and business information, so they should not be accessible to everyone by default.
Finally, test the logging behavior when dependencies fail. Simulate database timeouts, unavailable external APIs, request cancellations, and failed message processing. Verify that the resulting logs contain enough context to identify the problem without exposing sensitive information.
Summary
When an ASP.NET Core request passes through multiple services, a single error message rarely explains the complete failure. Developers need structured logs, consistent correlation, and distributed tracing to understand how a request moved through the system and where it failed.
ILogger<T> provides structured application logging, while .NET Activity and OpenTelemetry help connect operations across service boundaries. Together, they make it possible to investigate failures using request context, trace IDs, span information, execution durations, and meaningful application events.
The goal is not to log every operation or produce as much diagnostic information as possible. It is to capture the information that helps developers answer three important questions: What happened, where did it happen, and why did it fail?
When logging and tracing are designed around these questions, troubleshooting becomes faster, production incidents become easier to investigate, and development teams gain a much clearer understanding of application behavior.


Join the conversation! Your thoughts help the community grow.