
This is an article about the things I liked from the new updates in Visual Studio 2015. In this article I’ll be describing the new improvements I observed during debugging in Visual Studio 2015. These features are being frequently asked by developers via UserVoice and Microsoft regarding the ideas and here we have some of its features.
Last statement execution time
This would be more helpful for developers writing performance-sensitive applications. Though the time shown can vary from the actual, because if you’re in “Debug” mode then it has it’s own time to load symbols and other debugging data. But it’s more than just a value added. One can easily see the estimated time of execution of a statement by “Stepping Over” during debugging. Great feature!
Figure1: Execution Time
The Diagnostic tool. (Keep eye on your CPU and Memory usage when debugging – No more profiling)
This was the most awaited feature. Now developers don’t need to use profiling because everything is being provided right at spot in early stages of development; Memory, CPU usage and other stuff. Just launch the Visual Studio 2015 debugger and see for yourself. All of this is done using Intellisense and run-time profiling of the assembly. 
Figure 2: Diagnostic Tool
LINQ Expression evaluation (Most awaited feature – YAY!)
Visual Studio 2015 now has features to evaluate LINQ expressions on the fly when debugging. Now one can evaluate the collection objects on the fly with LINQ. This was a much-awaited feature remember those crazy days?). LINQ is one of the most liked features of the C# language. LINQ expressions can be used either via “QuickWatch…” or “ImmediateWindow”. How does that sound?
Figure 3: Expression Evaluation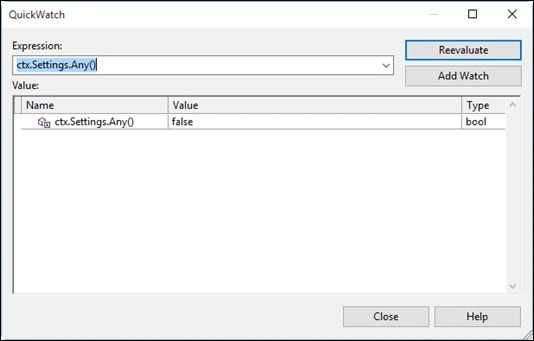
Figure 4: Quick Watch
Edit and Continue on x64 Machines
The Edit and Continue feature was only available for 32-bit machines in earlier versions of Visual Studio. But in VS 2015 it’s more enhanced and generates symbols and other debug information on the fly. The integration of Intellisense is more improved and much faster. Now any application including WPF can now “Edit and Continue” during debugging.
There are more improvements that I’m planning to share in future articles, so keep an eye for them if you like these articles.

New Debugging Features in VS 2015 RTM
Join the conversation! Your thoughts help the community grow.
Sign in to leave a comment
It is the same account you read, post and publish with — and you will come straight back to this page.
Santhakumar MunuswamyPosted Aug 16, 2015, 2:27 AM
Good Article. Thanks for sharing
Pankaj Kumar ChoudharyPosted Aug 14, 2015, 8:59 PM
Nice Explain Sir............
Sibeesh VenuPosted Aug 14, 2015, 6:56 AM
Nice Share :)
Michal HabalcikPosted Aug 14, 2015, 3:45 AM
that execution time is actually an amazing feature, it will improve optimization of long-running processess
Ankit BansalPosted Aug 14, 2015, 2:59 AM
nice..
Yashwanth MuthineniPosted Aug 14, 2015, 12:45 AM
Nice Article sir..
Neeraj KumarPosted Aug 14, 2015, 12:20 AM
NIce
Mohammed IbrahimPosted Aug 14, 2015, 12:11 AM
nice
Amit ChoudharyPosted Aug 13, 2015, 9:06 PM
Thanks all for kind words. I see there's typo "Figure 3: Expretion Evaluation" should be corrected to "Expression". Praveen Kumar can you ask someone from our Editor team to fix it.
Gopi ChandPosted Aug 13, 2015, 1:01 PM
Great one
RakeshPosted Aug 13, 2015, 10:13 AM
Good work sir
Rajeesh MenothPosted Aug 13, 2015, 8:39 AM
Good One Sir
Vipul MalhotraPosted Aug 13, 2015, 8:11 AM
Thanks for sharing sir
Ankit BansalPosted Aug 13, 2015, 7:41 AM
good one..
Gowtham RajamanickamPosted Aug 13, 2015, 4:49 AM
good one..
Sibeesh VenuPosted Aug 13, 2015, 4:27 AM
Nice Share :)
Praveen KumarPosted Aug 13, 2015, 3:01 AM
Nice features!
Vaikesh K PPosted Aug 13, 2015, 2:57 AM
Nice Work
Nilesh JadavPosted Aug 13, 2015, 2:49 AM
Nice features sir :) thank for sharing
Karthikeyan KPosted Aug 13, 2015, 2:40 AM
Good one...Thanks for sharing