

Introduction
In this article I show how to create a Pie Chart using Google Chart Tools in PHP. You can create a simple chart using Google Chart Tools. This is a very simple and provides a perfect way to visualize data on your website. The chart is exposed as JavaScript classes and all charts are populated with data using a common JavaScript data table class. The Google Chart Tool provides many types of charts. You can easily create a chart to fit the look and feel of your site. The Google Chart Tool is a very interesting way to create a chart.
Example
<html>
<head>
<!--Load the AJAX API-->
<script type="text/JavaScript" src="https://www.google.com/jsapi"></script>
<script type="text/JavaScript">
// Load the Visualization API and the pie chart package.
google.load('visualization', '1.0', { 'packages': ['corechart'] });
// Callback to run when the Google Visualization API is loaded.
google.setOnLoadCallback(PieChart);
// Callback that creates and populates a data table,
// instantiates the pie chart, passes in the data and draws it.
function PieChart() {
// Creating the chart data.
var data = new google.visualization.DataTable();
data.addColumn('String', 'topping');
data.addColumn('Number', 'slices');
data.addRows([
['Analyzer', 3],
['Designer', .5],
['Coder', 1],
['Tester', 1],
['Company', 4],
['Maintenance', .5],
]);
// You can set chart title and height, width
var options = {
'title': 'How many salaries should pay of software developers?',
'width': 500,
'height': 400
};
// Instantiate and draw our chart, passing in some options.
var chart = new google.visualization.PieChart(document.getElementById('chart_div'));
chart.draw(data, options);
}
</script>
</head>
<body>
<!--Div that will hold the pie chart-->
<div id="chart_div"></div>
</body>
</html>
Output
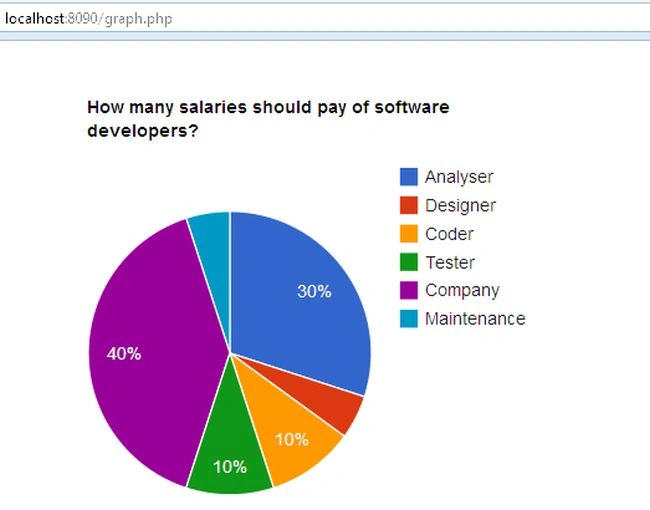
Reference
Join the conversation! Your thoughts help the community grow.