

Introduction
This article's intention is to explain the main skills measured in this sub-topic of the AZ-204 Certification. Application Insights, Azure Monitor, and Transient Faults are the main components that will have their fundamentals explained here alongside a practical example.
This certification is very extensive and this article approaches only the main topics, make sure you know those components in depth before taking the exam. Another great tip is to do exam simulators before the official exam in order to validate your knowledge.
What is the Certification AZ-204 - Developing Solutions for Microsoft Azure?
The AZ-204 - Developing Solutions for Microsoft Azure certification measures designing, building, testing, and maintaining skills of an application and/or service in the Microsoft Azure Cloud environment. It approaches, among others, those components.
- Azure Virtual Machines
- Docker
- Azure Containers
- Service Web App
- Azure Functions
- Cosmos DB
- Azure Storage
- Azure AD
- Azure Key Vault
- Azure Managed Identities
- Azure Redis Cache
- Azure Logic App
- Azure Event Grid
- Azure Event Hub
- Azure Notification Hub
- Azure Service Bus
- Azure Queue Storage
Target Audience
Any IT professional willing to improve his knowledge in Microsoft Azure is encouraged to take this certification, it is a great way to measure your skills within trending technologies. But, some groups of professionals are more keen to take maximum advantage of it,
- Azure Developers, with at least 1 year of experience with Microsoft Azure.
- Experienced Software Developers, looking for an Architect position in a hybrid environment.
- Software Developers, working to move applications to the cloud environment.
Skills Measured
According to today's date, the skills that are measured in the exam are split as follows.
- Develop Azure compute solutions (25-30%)
- Develop for Azure storage (10-15%)
- Implement Azure security (15-20%)
- Monitor, troubleshoot, and optimize Azure solutions (10-15%)
- Integrate caching and content delivery within solutions
- Instrument solutions to support monitoring and logging
- Connect to and consume Azure services and third-party services (25- 30%)
- Develop an App Service Logic App
- Implement API Management
- Develop event-based solutions
- Develop message-based solutions
Benefits of Getting Certified
The main benefit here is having a worldwide recognized certification that proves that you have knowledge of this topic. Among intrinsic and extrinsic benefits, we have,
- Higher growth potential, as certifications are a big plus.
- Discounts and deals in Microsoft products and partners, like PluralSight and UpWork.
- MCP Newsletters, with trending technologies.
- Higher exposure on LinkedIn, as recruiters usually search for specific certifications.
- With a higher salary, you will be more valuable to your company.
- Unique happiness when getting the result and you were approved, knowing that all your efforts were worth it.
Main Skills Measured by this Topic
What is Azure Monitor?
Azure Monitor is an Azure Service focused on monitoring your applications, working on applications hosted by Azure and, also by on-premises applications. The Azure Monitor is free for built-in log collection enabled automatically but has a cost if you need to create more customized queries and alerts.
Azure Monitor collects logs from your applications, and from those logs, you can create dashboards, alerts, queries, create automated tasks, and much more, as follows.
- Application Insights is used to monitor live applications.
- Log Analytics, is a powerful tool to analyze logs.
- Smart groups, grouping your alerts using ML for a better experience.
- Action rules, triggering actions based on alerts.
- Dashboards, to customize your centralized view of logs.
- Workbooks, to display visual reports.
Which data is collected from Azure Monitor?
Azure Monitor collects enough data to troubleshoot any kind of issue that could happen in your application or service as follows.
- Performance and functionality of the application code
- User Operational System data
- Azure Resource operations
- Azure Subscription operations
- Azure AD operations
- Azure Services health data
- Custom sources, using the Data Collection API
Analyze Log with Azure Monitor
Azure Monitor offers a wide variety of ways to use the logs collected from applications and services. From creating alerts to be triggered when some situations happen to creating complex queries to troubleshooting errors that happened in your application, those are the main functionalities and terminologies used to analyze logs with Azure Monitor.
- Log Profile, the legacy method to collect logs and store in Storage Accounts or sent by event hubs.
- Activity Log, logs for subscription-level events such as the creation of an Azure Service.
- Metric Chart, charts based on metrics.
- Alert, notifications from your service or application when an issue happens.
- Log Query, queries in logs using Kusto Query Language - KQL.
What is Application Insights?
Application Insights is part of Azure Monitor tools categorized as Application Performance Management (APM), to collect live logs from your application whereas it will automatically detect some issues and track users' interactions inside your applications. It is an excellent tool to understand how your users are using your applications as far as troubleshooting problems.
To use Application Insights inside your application you have to install its SDK and configure the instrumentation inside your application, those instrumentations are going to monitor your application and send those logs to Azure Application Insights resource for better visualization. Application Insights has built-in powerful instrumentation and it also gives you the opportunity to create your customized one, Azure Application Insights built-in instrumentation tracks the following.
- Request Rates, response times, and failure rates from internal and external services
- Exceptions
- Page views and performance, captured by your user's browsers
- AJAX calls
- User and session counts, how many users and sessions were acknowledged
- CPU, memory, and network usage performance counters
- Host diagnostics
- Trace Logs, to correlate with events
- Custom events or metrics, created by you
Instrumentation in Application Insights
Application Insights has a wide range of instrumentation tools, each one with its own importance and functionality. Below you will find the most common instrumentation tools from Azure Application Insights.
- Sampling is a great way to reduce traffic by not sending all telemetry but a sample of it. Has 3 types.
- Adaptive, automatically adjusts the sample size
- Fixed-Rate, you set the sample size
- Ingestion receives all data but only stores a part of it while the other logs are discarded. It is good to reduce the logs stored in Azure.
- Performance counters, such as CPU, memory, disk, and network usage
- Logs, logs created from your logging framework
- Live Metrics, has your live metrics from your application such as Incoming and Outgoing Requests
- Event Counter counts custom events created by you
- Snapshot debugger, where you can collect a debug snapshot from your application when an exception happened
Web Tests and Alerts in Application Insights
Application Insights is always monitoring your application, and external resources used by your applications if applicable, and you can configure alerts to be notified when something is not going as expected. For example, you can create an alert to be triggered when the application goes down or if the application is slower than normal, those features are also extendable to your external resources.
With Application Insights Web Tests, you can create multi-step web tests using Visual Studio for your web services in order to validate if your external sources are still valid and have not changed. It is important to notice that Multi-Step Web Tests are deprecated and will not be available in future versions of Visual Studio.
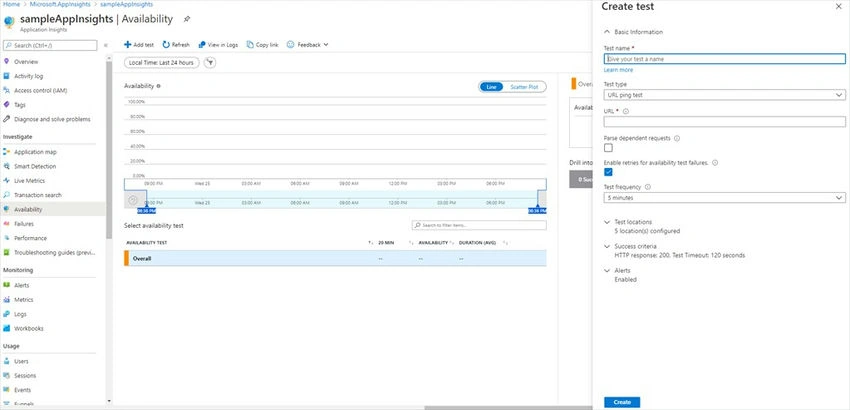
There is another type of Web Test, the URL Ping test that is a great way to automate an availability health check for your applications. With Application Insights URL Ping Availability Tests, you can customize the frequency, acceptance criteria, URL, and locations that this test will run.
Application Insights Alerts is another tool to monitor your application, you can select from a wide range of pre-built conditions to customize your alerts and, select the action group to be executed when those conditions are met.
What are Transient Faults?
Transient Faults is the name given when your application tries to access an external source without success, those errors are usually transients and related to connectivity issues and must be handled correctly in order to avoid a bad user experience with your application. Transient faults can be handled with a simple retry engine and most of the remote services already have a built-in strategy mechanism to address it.
Handling Transient Faults' main good practices.
- Use the built-in mechanism when available.
- Validate if makes sense to retry connecting, maybe your external service is dead instead of down.
- Check how many retries and the interval between retries are needed, each application has its own behavior when going down.
- Log and track every time, successful or not, you access your external service.
- Avoid concurrent retries among your application, by retrying to access the external service through different layers.
- From time to time review and adapt your mechanism.
- Exhaustively test your fault mechanism.
Practical Samples
Application Insights With .Net Core Web API
Pre-Requisites
- .Net Core Web Application
- Nuget Microsoft.ApplicationInsights.AspNetCore
Application Insights Creation from Azure Portal
From your Azure Portal, go to Application Insights and create a new one. Fill out the form and create it.
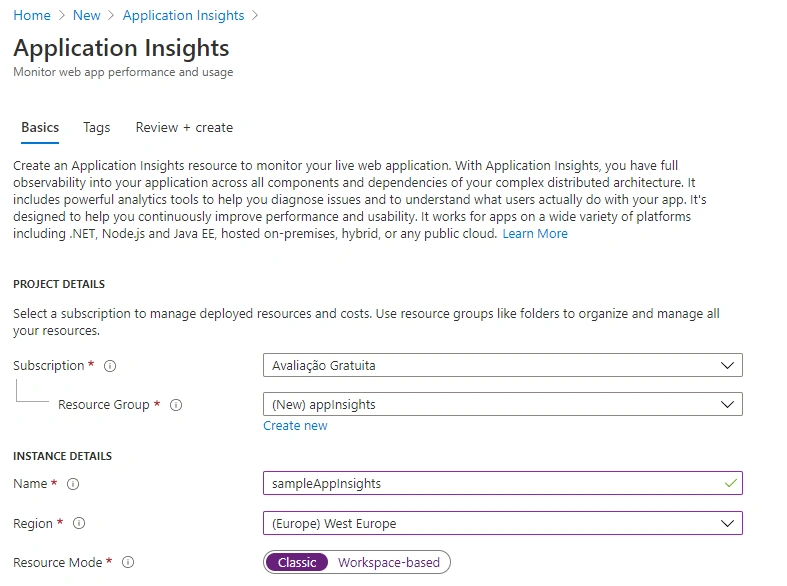
Application Insights Creation from PowerShell.
New-AzApplicationInsights -Kind web -ResourceGroupName appInsights -Name sampleAppInsights -location westeurope
Application Insights Configuration
From your Application Insights Resource, get your instrumentation key.
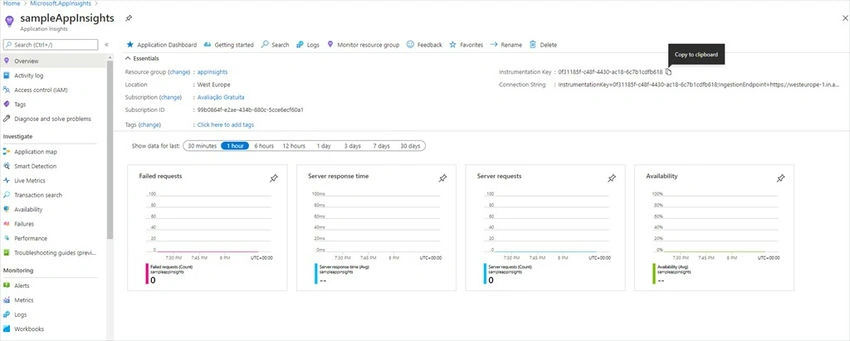
Set your configuration key in appSettings.json.
{
  "Logging": {
    "LogLevel": {
      "Default": "Information",
      "Microsoft": "Warning",
      "Microsoft.Hosting.Lifetime": "Information"
    }
  },
  "ApplicationInsights": {
    "InstrumentationKey": "0f31185f-c48f-4430-ac18-6c7b1cdfb618",
    "EnableAdaptiveSampling": false,
    "EnablePerformanceCounterCollectionModule": false
  },
  "AllowedHosts": "*"
}
Update your Startup. cs to initialize telemetry.
public void ConfigureServices(IServiceCollection services)
{
    // Enables Application Insights telemetry collection
    services.AddApplicationInsightsTelemetry();
    services.AddControllers();
}
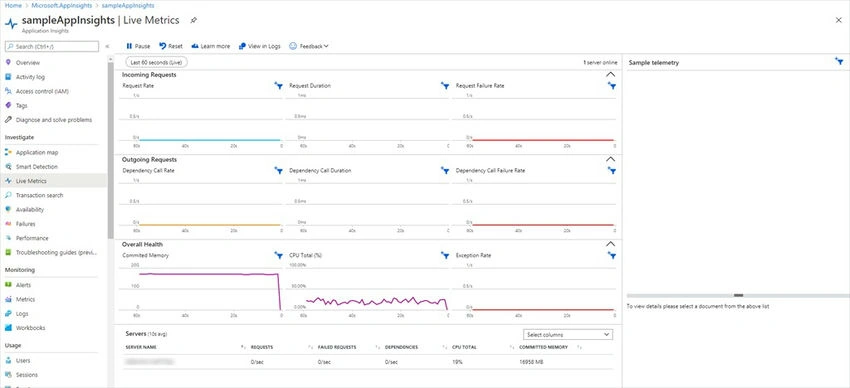
And.. that's all! It is that easy to configure Application Insights to collect data from your project and you can check the live metrics feature from your Azure Application Insights resource.
Application Insights Web Tests
Using Azure Portal, from your Application Insights resource go to Availability under Investigate and then click on Add test.
Application Insights Alerts
Using Azure Portal, from your Application Insights resource go to Alerts under Monitoring and then click on New Alert Rule.
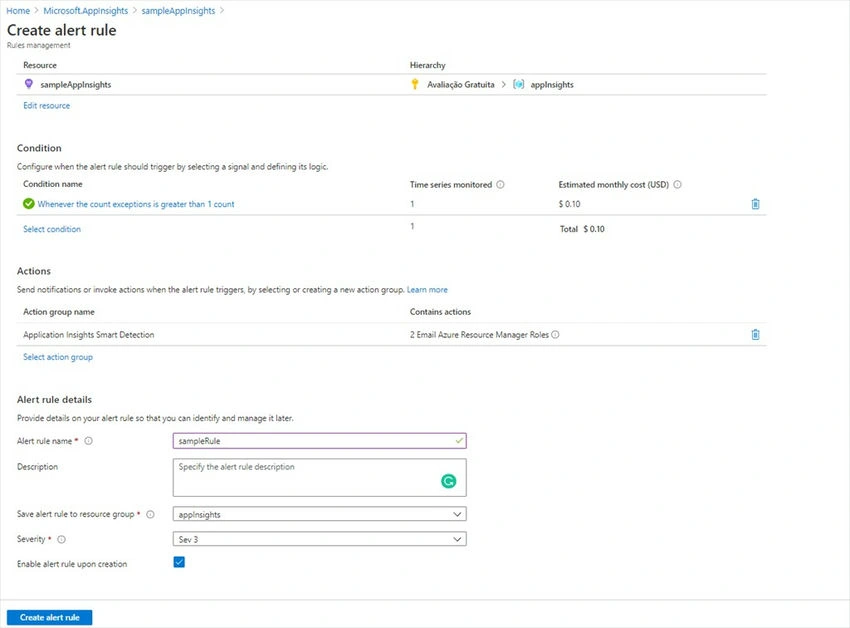
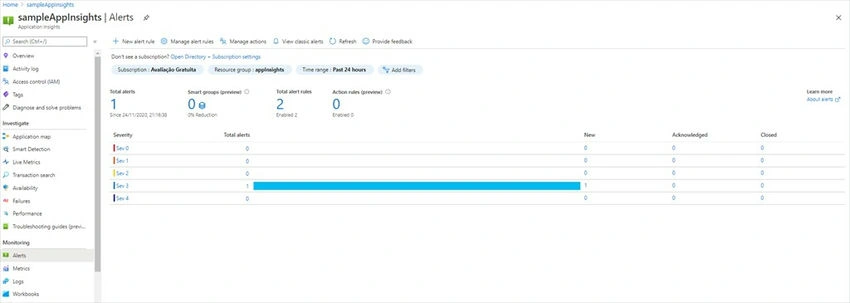
Result when the alert is triggered.
Azure Monitor
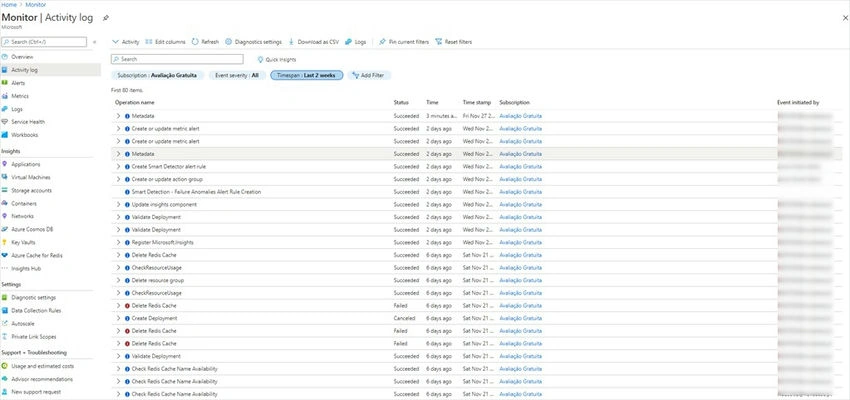
Collecting Activity Logs with Azure Monitor.
From Azure Portal, go to your Azure Monitor, then go to Activity Logs.
Using Azure CLI
az monitor activity-log list
Creating a Metric Chart with Azure Monitor
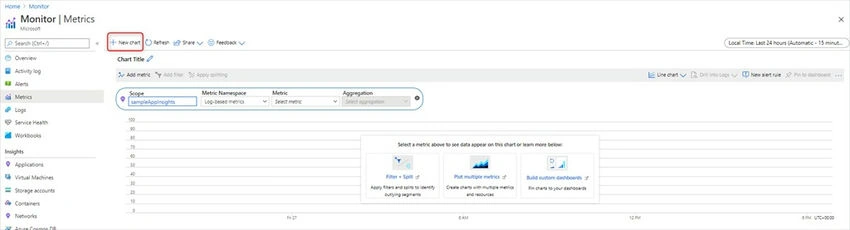
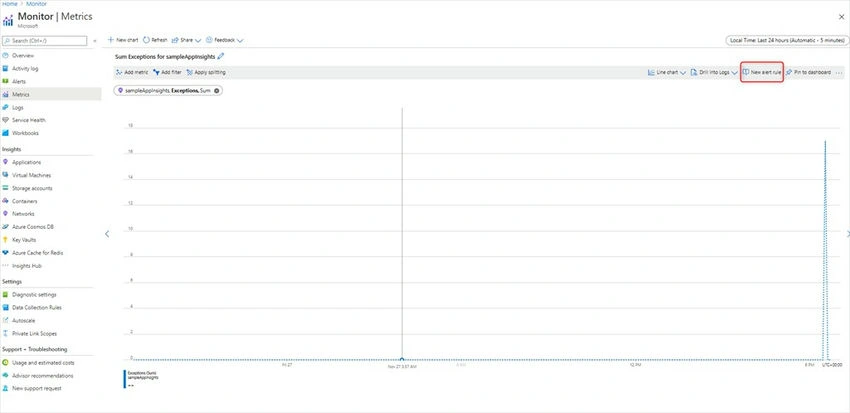
From Azure Portal, go to your Azure Monitor and then Metrics. Click on New Chart and then configure your metric chart.
Creating Alerts with Azure Monitor
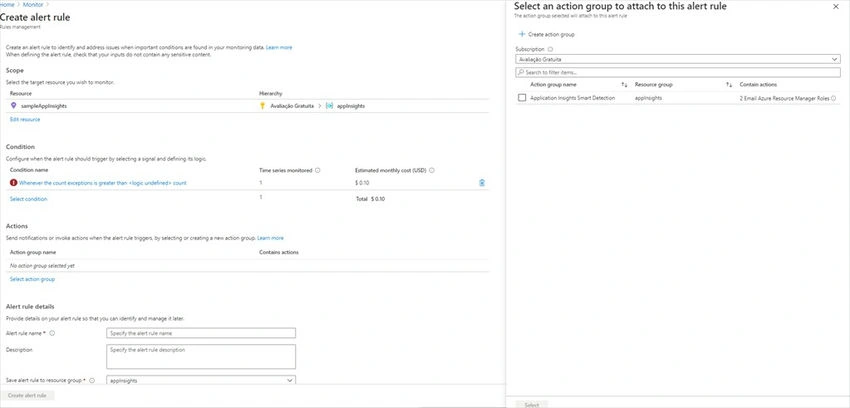
To create an alert based on a metric chart using Azure Portal, from your Metric Chart click on the button New Alert Rule
Configure the Action and create the alert.
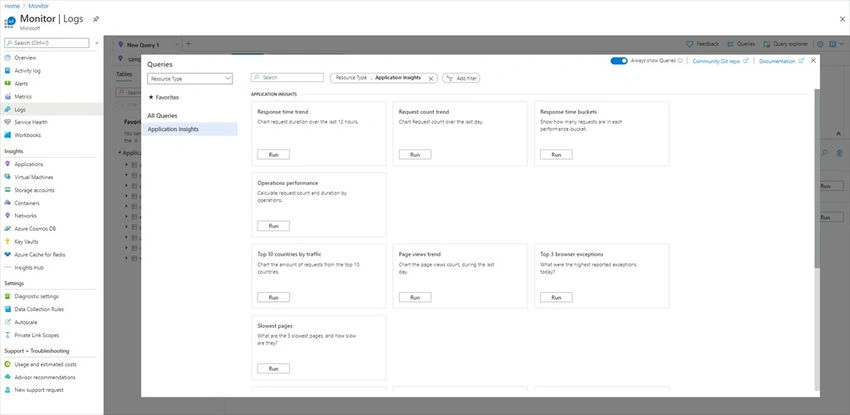
Log Query With Azure Monitor
From your Azure Monitor, go to Logs. Azure Monitor has some built-in queries for usage as follows.
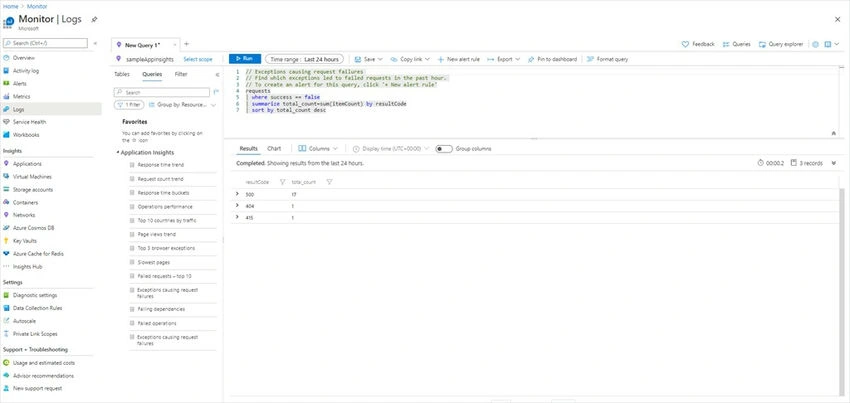
If we select on and click on Run we have the result.
Transient Faults
Handling Transient Faults usually are specific to each type of component that we are trying to access, each component has its own code to handle the faults. So I present to you two articles from friends that explain different types of handling transient faults.
- Using Retry Pattern In ASP.NET Core Via Polly
- RetryPolicy Using Microsoft Practices Enterprise Library
Join the conversation! Your thoughts help the community grow.