

Introduction
This blog explains how to use Highchart in ASP.NET. Highchart is purely a JavaScript and jQuery based API which can create interactive charts for representing the data. Highchart is a client-side API and it is flexible for use on different kinds of web browsers.

Features of Highchart
- Compatible: Highchart works on all kinds of browsers.
- Highchart is free for non-commercial purposes.
- Different types of charts are available.
- We can easily integrate it with .NET.
Types of Charts
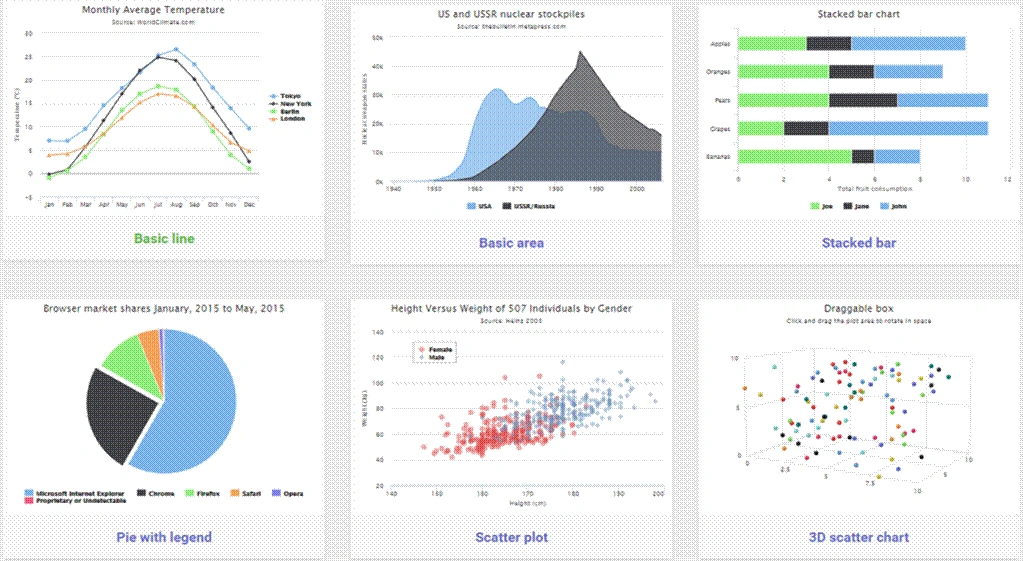
Highcharts support different types of charts, such as:
- Gauges
- Basic Area chart
- Bar chart
- Column chart
- Line chart
- Pie chart
- Polar chart
- Range series
How it works
- Download this dll and add to your project:
- Download and add JavaScript to your project:
- Chart Creation
- Chart Output
Step 1
- Download this dll to add to your project or install NET Highcharts.
- You can follow the below steps.


Step 2
- Download Highcharts and add reference of the JavaScript in your page or master page:
- Add the below script
- <script src="../../Scripts/jquery-1.5.1.min.js" type="text/javascript"></script>
- <script src="../../Scripts/highcharts.js" type="text/javascript"></script>
Step 3
- Chart Creation
HTML Code- Below code
- for Mvc
- public ActionResult Index() {
- DotNet.Highcharts.Highcharts chart = new DotNet.Highcharts.Highcharts("chart").SetXAxis(new XAxis {
- Categories = new [] {
- "Jan",
- "Feb",
- "Mar",
- "Apr",
- "May",
- "Jun",
- "Jul",
- "Aug",
- "Sep",
- "Oct",
- "Nov",
- Dec " }
- }).SetSeries(new Series {
- Data = new Data(new object[] {
- 29.9,
- 71.5,
- 106.4,
- 129.2,
- 144.0,
- 176.0,
- 135.6,
- 148.5,
- 216.4,
- .1,
- 95.6,
- 54.4
- })
- });
- return View(chart);
- }
- Below Code
- for Asp.net
- protected void Page_Load(object sender, EventArgs e) {
- DotNet.Highcharts.Highcharts chart = new DotNet.Highcharts.Highcharts("chart").SetXAxis(new XAxis {
- Categories = new [] {
- "Jan",
- "Feb",
- "Mar",
- "Apr",
- "May",
- "Jun",
- "Jul",
- "Aug",
- "Sep",
- "Oct",
- "Nov",
- "Dec"
- }
- }).SetSeries(new Series {
- Data = new Data(new object[] {
- 29.9,
- 71.5,
- 106.4,
- 129.2,
- 144.0,
- 176.0,
- 135.6,
- 148.5,
- 216.4,
- 194.1,
- 95.6,
- 54.4
- })
- });
- ltrChart.Text = chart.ToHtmlString();
- }
- For Mvc
- @model DotNet.Highcharts.Highcharts
- @(Model)
- For Asp.net < asp: Content ID = "BodyContent"
- runat = "server"
- ContentPlaceHolderID = "MainContent" > < asp: Literal ID = "ltrChart"
- runat = "server" > < /asp:Literal> < /asp:Content>
Step 4
We get the output like the below image.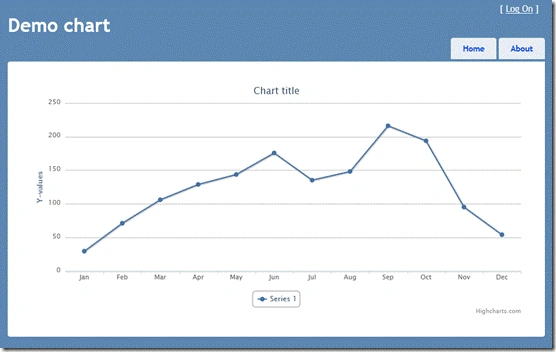
amir ameriPosted Dec 4, 2018, 4:53 AM
Hi . I Use High chart in my web site in asp.net C# and used dll for create chart and series in page load . Highcharts pieHChart = new Highcharts("pieChart"); DotNet.Highcharts.Options.Series pieHChartSeries = new DotNet.Highcharts.Options.Series(); i want add data to pieHChart series in for loop. how i can add data to this series?my chart is Pie Chart
NehaPosted Dec 29, 2016, 8:45 AM
Nice one...........................................
Jaco ZwartsPosted Dec 8, 2016, 2:04 AM
Thank you for sharing Ananth