Introduction
This is a short and sweet FAQ which iterates through the most common metrics which will help you judge your project health.
We have been developing lot of videos for project managers and architects , you can see all my videos at http://www.questpond.com/ , do let me know your feedbacks.
PV (Planned Value):- PV is also termed as (BCWS) Budgeted cost of work scheduled. It answers "How much do we plan to spend till this date?". It's the total budgeted cost for the project.
AC (Actual Cost):- AC is also termed as ACWP (Actual cost of Work Scheduled). It answers "How much have we actually spent?".
EV (Earned Value):- EV is also termed as BCWP (Budgeted Cost of Work Performed). It answers "How much work has actually been completed?".
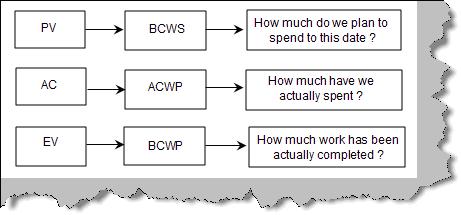
Figure: - PV, AC and EV
Many project managers traditionally use only Actual and Planned values. But it's very much possible that you will not get proper results from the same. For instance consider the project shown in figure 'Actual and Planned'. The project duration is 5 weeks. According to the planned value graph in Week1 we will spend 600$, in week3 we will spend 3800 $ and on the completion of project it is 6000$.
But we where getting computers at a discounted cost in Week1 itself so we bought the computer. According to plan we are supposed to spend in Week1 750 $ but in actual we have spent 3000$. By comparing with the actual plan value we have concluded that we over budget by 2250 $ in the first week. But that's not the actual case; in reality we bought the computers on discounted rate. So the graph is showing something really wrong. This issue is solved by using EV (Earned Value).
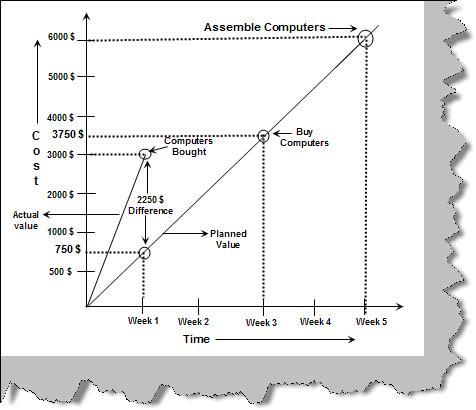
Figure: - Actual and Planned
Earned Value measures progress and gives us forecasting, thus giving us an actual measure of the health of the project. For instance see the figure 'Earned Value'. We have given two views one is the planned value and the other is the earned value. According to the planned value it's a four week project with 25% (2500 $) work completed on Week1, 50 % (5000$) work completed on Week2 and so on. Now when the project starts executing on Week1 only 20% work is completed which means we have spent 2000$ and on week2 only 30 % work is completed. 2000$ and 3000$ shows the earned value for Week1 and Week2.
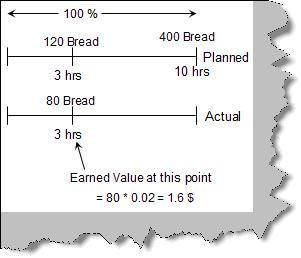
Figure: - Earned Value
Can you explain BCWS, ACWS and BCWP?
Please refer the above question.
Earned Value gives us three metric views for a project.
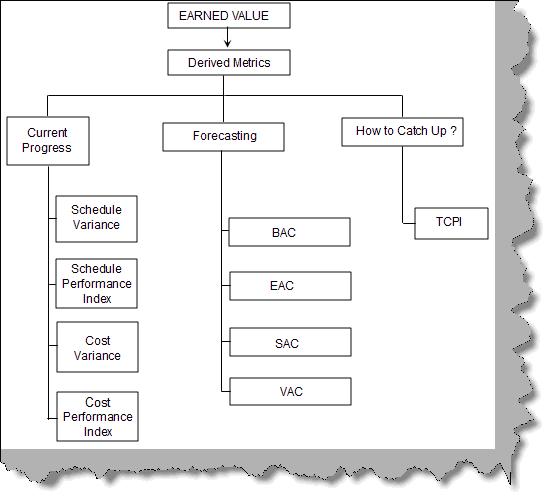
Figure: - Earned Value Metrics
Current Progress: - This shows how we are performing in the project.
Forecasting: - Will help us answer how we will do in the project in future.
How will we catch up: - In case the project is moving behind schedule or over budget how do we make up?
Current Progress metrics
Schedule Variance (SV)
Schedule variance is the difference between Earned value and planned value
|
CV |
Description |
|
0 |
You are on right on budget. |
|
Negative |
You are over budget. |
|
Positive |
you are under budget. |
Cost Variance (CV)
Cost variance is the difference between earned value and the actual cost.
|
CPI |
Description |
|
1 |
You are right on budget. |
|
Less than 1 |
You are over budget. |
|
Greater than 1 |
you are under budget. |
Cost performance Index (CPI)
CPI is the ratio of Earned value to Actual cost.
|
SPI |
Description |
|
1 |
You are right on schedule. |
|
Less than 1 |
You are behind schedule. |
|
Greater than 1 |
you are ahead of schedule. |
Schedule performance Index
SPI is the ratio of (Earned Value) EV to (Planned Value) PV.
|
SPI |
Description |
|
1 |
You are right on schedule. |
|
Less than 1 |
You are behind schedule. |
|
Greater than 1 |
you are ahead of schedule. |
Forecasting
EVA helps us to also forecast our project schedule below is the metrics for the same
|
Metric's Name |
Description |
|
Budget at completion ( BAC ) |
This is the total original budgeted cost. It is same as the planned value. |
|
Estimate at completion ( EAC ) |
This is the final cost of the project. EAC = PV / CPI where PV is the planned value and CPI is the cost performance index. |
|
Schedule at completion ( SAC ) |
This represents the estimated duration of the project. SAC = Schedule / SPI Where schedule is the estimate schedule and SPI is the schedule performance index. |
|
VAC ( Variance at Completion ) |
It is the forecast of the final cost variance. VAC = BAC - EAC. |
How will we catch up?
This is the third view which EV gives us. If the project is not on schedule how do we catch up with the same?. EV gives us something called as To-Complete performance Index (TCPI). TCPI is in an indication of how much we should perform to meet the project schedule.
|
TCPI = ( Planned budget - EV ) / ( Final cost - AC ) |
|
TCPI |
Description |
|
Greater than 1 |
We need to perform better than the schedule. |
|
Less than 1 |
We can reach the destination with schedule. |
Let's take a small sample project. We need to make 400 breads and following is the estimation of the project:-
-
We need to make 400 breads.
-
It will take 10 hours to make 400 breads.
-
Each bread will cost 0.02 $.
-
Total cost of making 400 breads is 400 X 0.02 = 8$.
-
In one hour we should be able to make 40 breads.
Below graph "Bread Project" shows the planned value and the actual cost graph. According to the planned value in 3 hours we will make 120 breads, in 7 hours we will make 280 breads and finally we will complete the 400 bread target in 10 hours. As the project moves ahead actually in the 3 rd hour we have only completed 80 breads with 3$ spent.
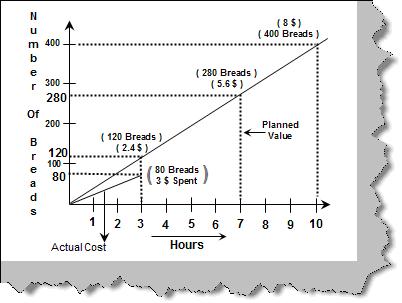
Figure: - Bread Project
Ok, now that we know the actuals its time to calculate the EV, PV and the AC.
In the 3rd hour below is the analysis.
|
PV (Planned value) = 120 * 0.02 = 2.4 $.
AC (Actual Cost) = 3$ |
Now it's the time to calculate the earned value. Below figure 'Earned Value for Bread' shows the simplified view of the bread projec
Figure: - Earned Value for Bread
EV (Earned Value) = 80 * 0.02 = 1.6$ (How much work has been completed?). So let's do all calculations.
|
Metrics |
Calculations |
|
SV = EV - PV |
1.6 - 2.4 = -0.8 ( We are behind schedule ) |
|
CV = EV - AC |
1.6 - 3 = -1.4 ( We are over budget ) |
|
SPI = EV/PV |
1.6/2.4 = 0.6 ( We are behind schedule ) |
|
CPI = EV/AC |
1.6/3 = 0.53 ( We are over budget ) |
|
TCPI = ( Planned - EV ) / ( Final - AC ) |
(8-1.6)/(8-3) = 1.28 i.e. ( We have to perform 128 percent higher to reach our goal of making 400 breads in 10 hours )
|