

Introduction
R has become the leading choice for data science professionals and statisticians. The popularity of R has increased substantially over the years when it comes to data analysis. R is a GNU project, which was initially developed by Ross Ihaka and Robert Gentleman at the University of Auckland, New Zealand, and the source code for R software environment is written primarily in C and Fortran. The founders decided to name the programming language R, based on the first letter of their names. The language is both similar and different in many ways when compared to the language S, developed by Bell Labs. R is considered to be a different implementation of S. Most of the code written for S runs in R as well.

- Just like any other programming language, the programming constructs that makeup R are well defined which includes variables, a condition making statements, loops, functions, data types, and so on.
- R provides the data structures like vectors, matrices, arrays, and data frames that users can use for performing statistical analysis and creating graphs.
- R supports object-oriented programming.
- R has mature, effective data handling and a storage facility. We can import data from CSV, MS Excel, and other data sources, which will be stored and can be used to analyze the data. We do not require an external DB.
- There are a lot of tools available to perform the data analysis within the R environment.
- R can be used to generate statistical graphs, which will help in deriving business intelligence. It has advanced graphics and plotting abilities. R Plot is an interface available in R Tools for Visual Studio, which provides an advanced graphic display.
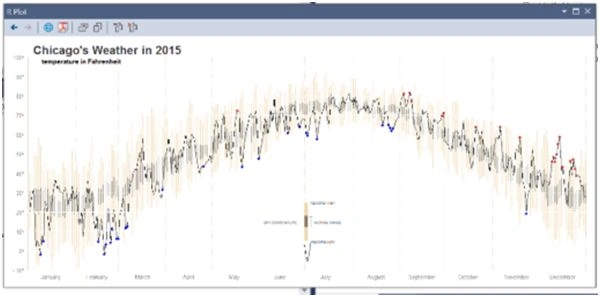 Image Source- r-bloggers.com
Defining R and its features might look pretty vague. Let’s start and get our hands dirty.
This article is divided into two main sections,
- Setting up R Environment and R Tools in Visual Studio IDE
- Understanding the power of R - Analyze and derive the conclusion from data, using R
Once this is completed, you will get an idea of setting up the R environment locally and it will help you get started with R programming. Let’s head to the first section of the article.
Setting Up R Environment and R Tools in Visual Studio
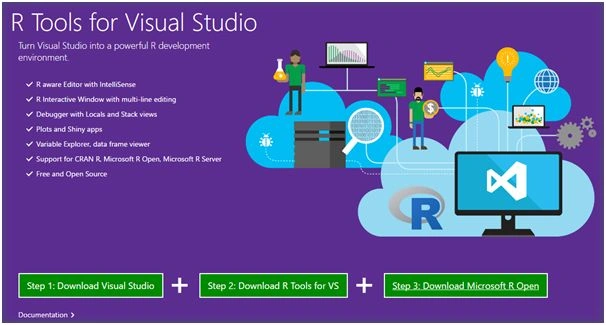 R tools for Visual Studio were released in March as a public preview release. This will help you to work with R programming in VS. However, in order to set up R Tools in Visual Studio, there is a prerequisite – R language engine should be installed in the local machine, or else we will get the error, shown below:
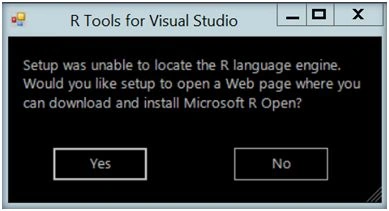 In order to set up the environment, first, we will:
- Install Microsoft R Open. It is an R language Engine and
- Install R tools in Visual Studio, which will help us to work with the data, using R programming.
Hence, let’s install Microsoft R Open, which will install the R language engine in the local machine. You can download Microsoft R Open from here.
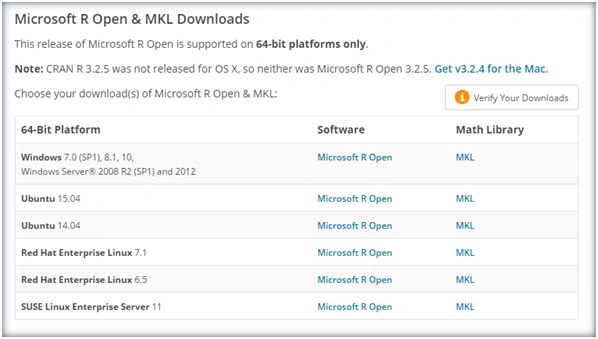 Depending on the platform, you can chose to download the appropriate R Open executable. I have downloaded the Windows 7 Platform executable.
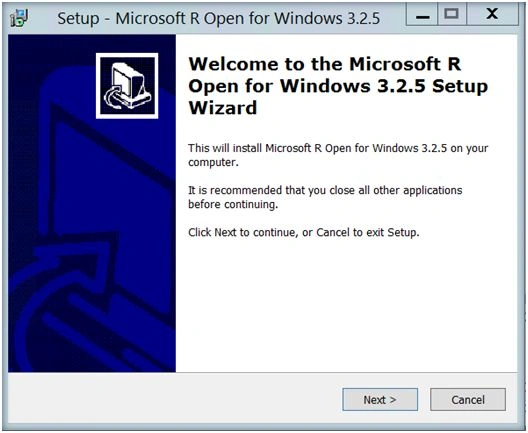 Double click the exe and click next.
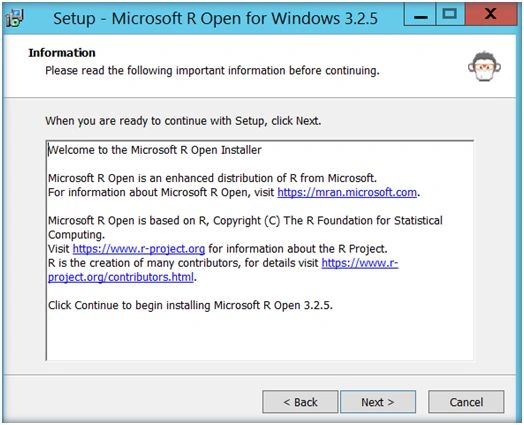 Click Next. This will start installing Microsoft R Open.
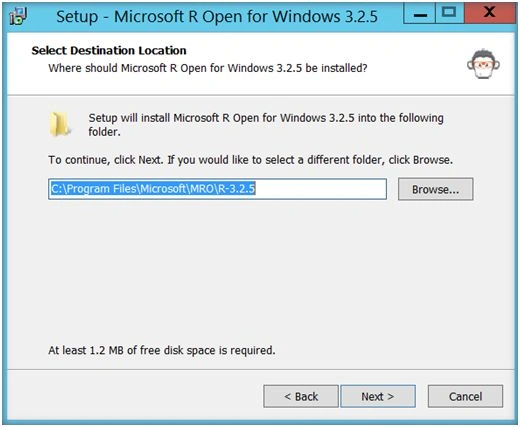 Specify the destination location or leave the default location as it is.
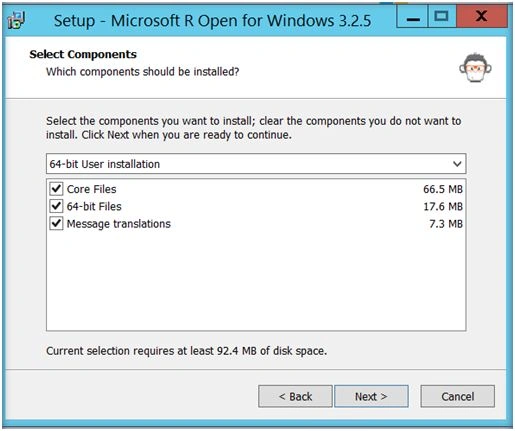 Select the components required to be installed. Ideally, leave all of them checked.
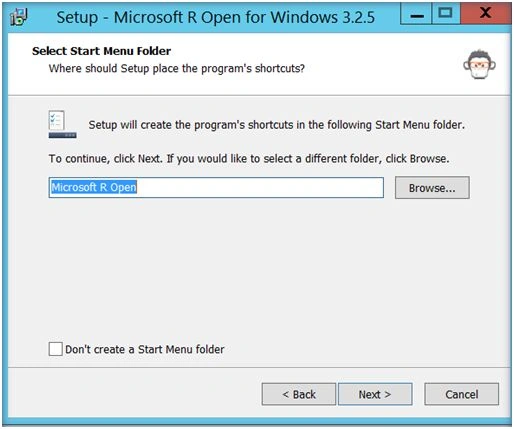 Click next.
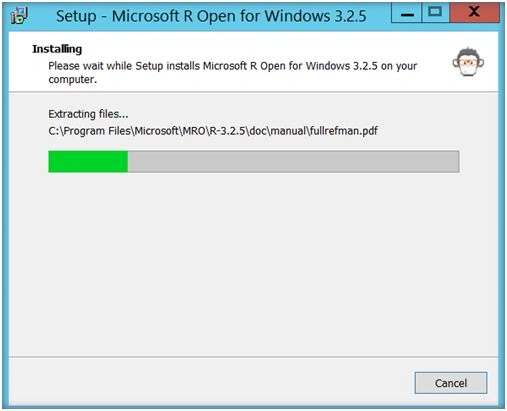 This will start the installation. Wait for the installation to complete.
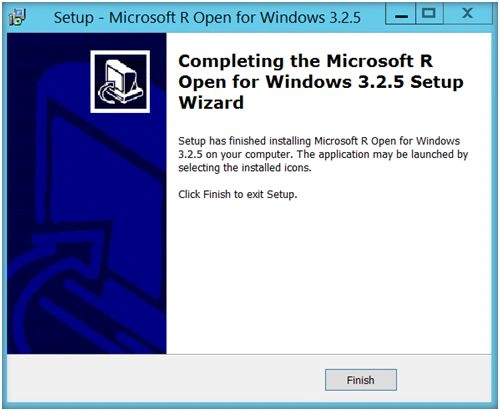 Click finish. This would complete the R language Engine installation in the local machine. Once completed, it will provide us the R console, where we can implement R Programming.
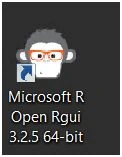 Double click the icon and it opens up R console.
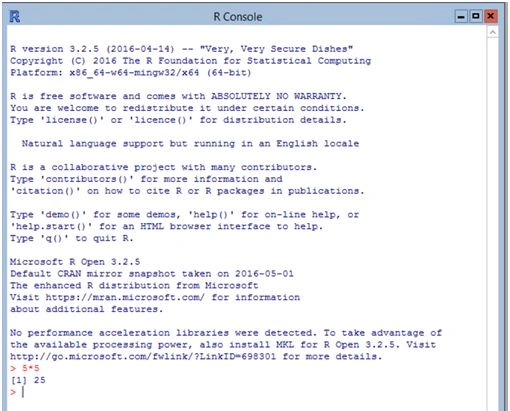 We can test its functionality by using normal arithmetic operations. However, the console is less interactive. Hence, let’s spin up Visual Studio IDE and install R Tools for Visual Studio (RTVS), which is a highly flexible and a mature environment to implement R Programming. You can get the executable from here.
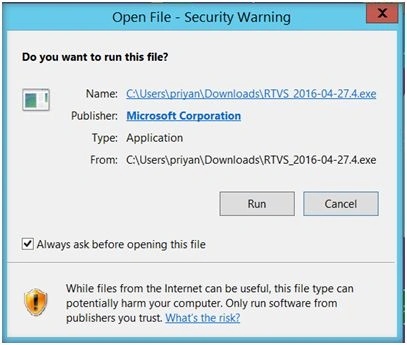 Click the executable and run it.
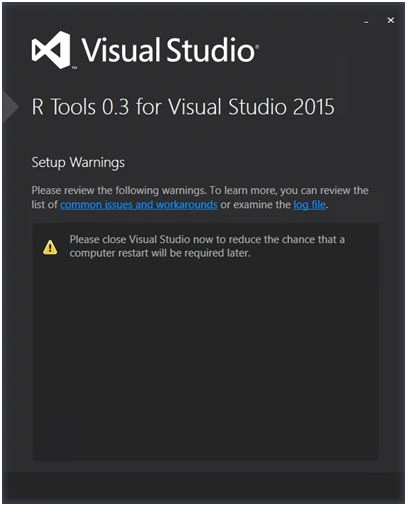 Close any Visual Studio session, that is active for a smooth installation.
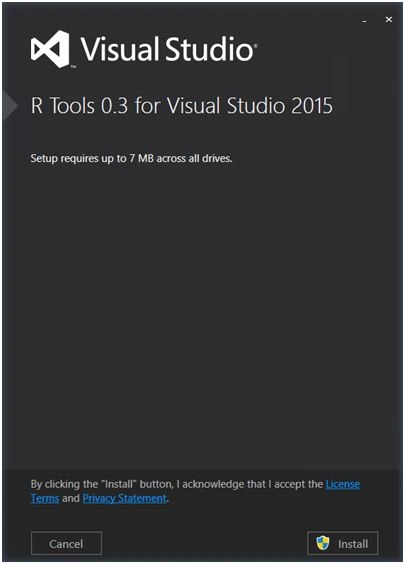 Click install.
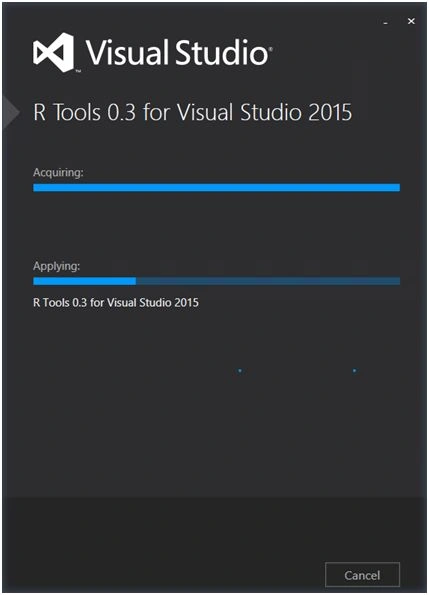 This will start the installation of R Tools in Visual Studio.
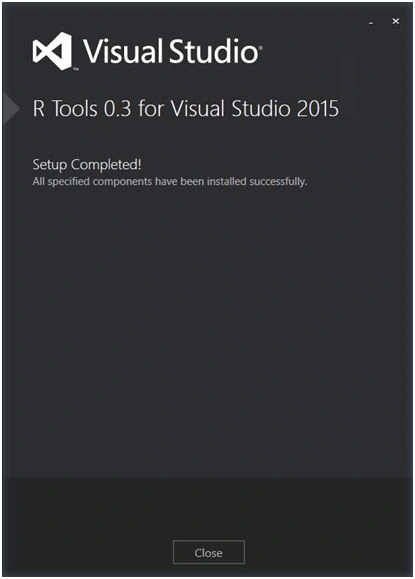 The setup is completed. Let’s head to Visual Studio to check out the new addition.
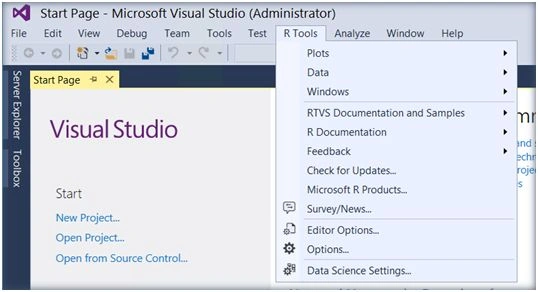 In the tab next to the test, we have the new tab for R Tools. Click data science settings so that the session opens in the data scientist profile.
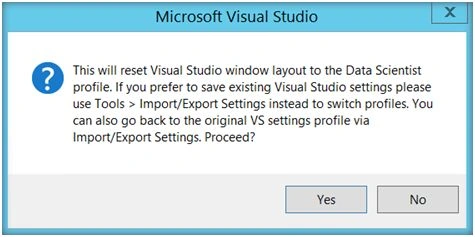 Click yes. This will reset the Visual Studio layout to the snapshot, shown below:
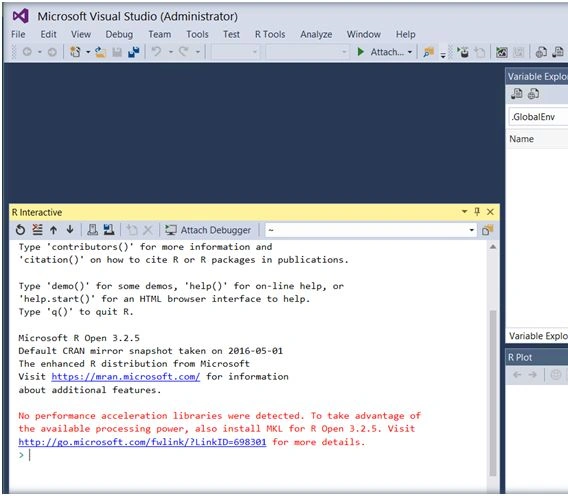 We have the R Interactive Window on the left side, where we will be doing the programming part. The variable Explorer on the top right end is where we can analyze the loaded variables and import the data from an external data source. R Plot at the bottom right corner is used to display the graphical representations. We can switch back to the default Visual Studio Layout once, we are done with R Programming.
Understand the Power of R - Analyze and derive a conclusion from data using R
Let’s use R programming to dig into bulk data and derive the results for our specific queries. Here, I am using dummy student details, which are in CSV format as the input and I will try to derive the answers for the data-related questions. We will be entering the commands in R Interactive Window on the left side of the Window.
First, we have to set the working directory, which can be done using setwd method.
We have the R Interactive Window on the left side, where we will be doing the programming part. The variable Explorer on the top right end is where we can analyze the loaded variables and import the data from an external data source. R Plot at the bottom right corner is used to display the graphical representations. We can switch back to the default Visual Studio Layout once, we are done with R Programming.
Understand the Power of R - Analyze and derive a conclusion from data using R
Let’s use R programming to dig into bulk data and derive the results for our specific queries. Here, I am using dummy student details, which are in CSV format as the input and I will try to derive the answers for the data-related questions. We will be entering the commands in R Interactive Window on the left side of the Window.
First, we have to set the working directory, which can be done using setwd method.
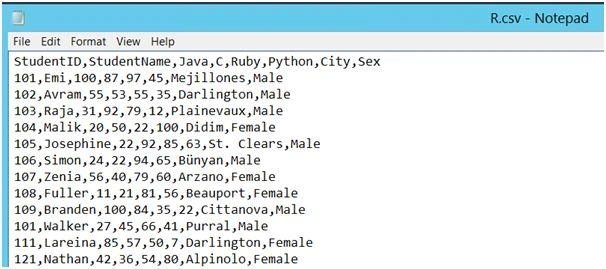
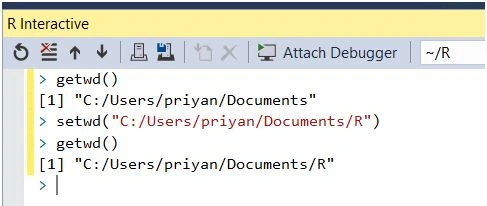 Now, let’s load the data into the R Tools environment in Visual Studio. We can use read CSV command to import the data from CSV. I have placed the R CSV file, which contains the student details, in the working directory. This file looks as shown below:
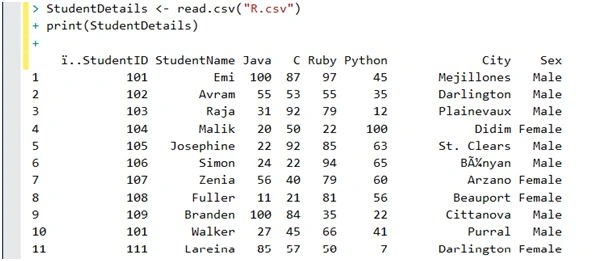
 Now, let’s load the CSV file into Visual Studio. We can read from other data sources like MS Excel as well.
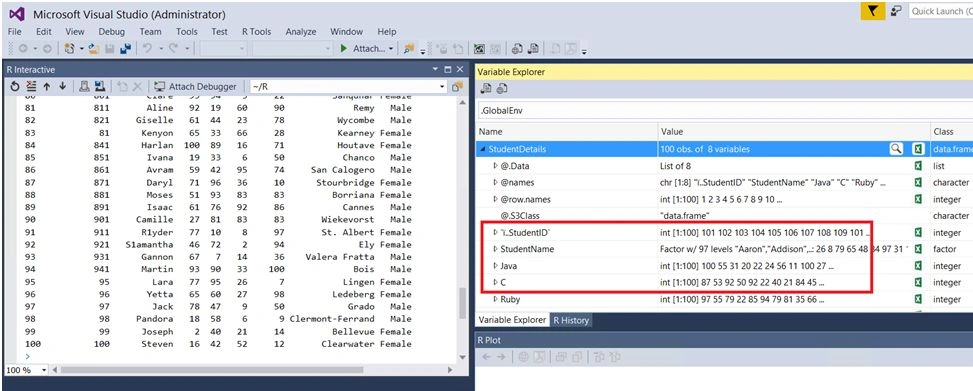
- StudentDetails<- read.csv("R.csv")
- print(StudentDetails)
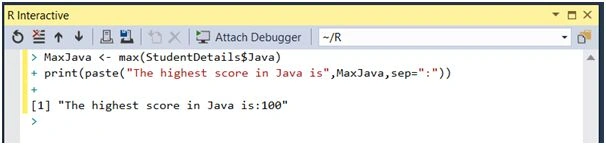
- MaxJava<- max(StudentDetails$Java)
- print(paste("The highest score in Java is",MaxJava,sep=":"))
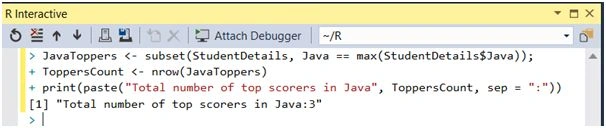
- JavaToppers<- subset(StudentDetails, Java == max(StudentDetails$Java));
- ToppersCount<- nrow(JavaToppers)
- print(paste("Total number of top scorers in Java", ToppersCount, sep = ":"))
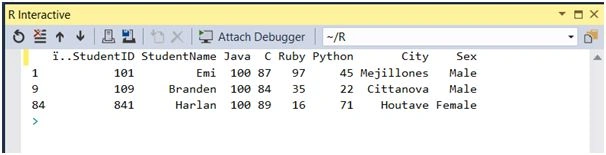
- JavaToppers<- subset(StudentDetails, Java == max(StudentDetails$Java))
- print(JavaToppers)
- MeanPython<- mean(StudentDetails$Python)
- print(paste("The Average score in Python is", MeanPython, sep = ":"))

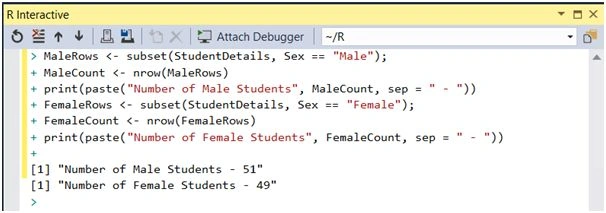
- MaleRows<- subset(StudentDetails, Sex == "Male");
- MaleCount<- nrow(MaleRows)
- print(paste("Number of Male Students", MaleCount, sep = " - "))
- FemaleRows<- subset(StudentDetails, Sex == "Female");
- FemaleCount<- nrow(FemaleRows)
- print(paste("Number of Female Students", FemaleCount, sep = " - "))
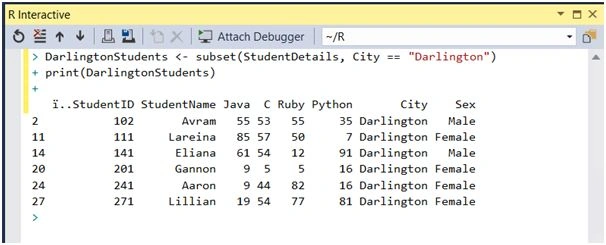
- DarlingtonStudents<- subset(StudentDetails, City == "Darlington")
- print(DarlingtonStudents)
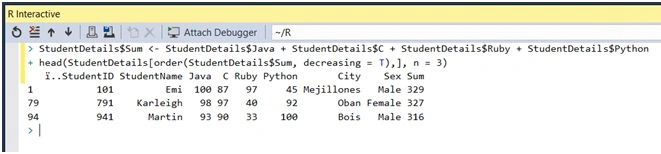
- StudentDetails$Sum<- StudentDetails$Java + StudentDetails$C + StudentDetails$Ruby + StudentDetails$Python
- head(StudentDetails[order(StudentDetails$Sum, decreasing = T),], n = 3)
Here, we are summing up the scores in Java, C , Ruby, and Python and assigning it to a new column SUM, which is not really present in the import table.
StudentDetails$Sum<- Some Value will create a new column in the table and assign the value to the column. Finally, we are ordering the table in the descending order and use the Head method to get the top rows.NowN=3 will fetch only the first three rows.
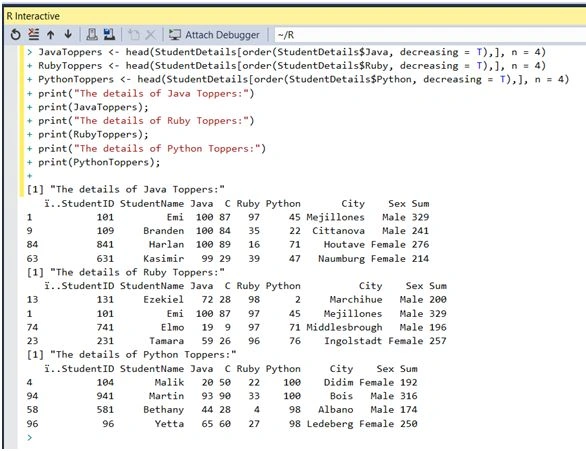
- JavaToppers<- head(StudentDetails[order(StudentDetails$Java, decreasing = T),], n = 4)
- RubyToppers<- head(StudentDetails[order(StudentDetails$Ruby, decreasing = T),], n = 4)
- PythonToppers<- head(StudentDetails[order(StudentDetails$Python, decreasing = T),], n = 4)
- print("The details of Java Toppers:")
- print(JavaToppers);
- print("The details of Ruby Toppers:")
- print(RubyToppers);
- print("The details of Python Toppers:")
- print(PythonToppers);
Hadshana KamalanathanPosted Jul 22, 2018, 3:59 AM
Useful one
Santhakumar MunuswamyPosted Jun 25, 2016, 2:23 AM
Thank you for nice article
Praveen SreeramPosted Jun 21, 2016, 5:20 AM
Few questions that I have (1) Is it possible to join two spreadsheets and display data by combining the columns of those two excel sheets? (2) Is there is any limitation of the excel sheet (or any data source) size that R can process? (3) Let's say, I have multiple spreadsheets (with the same columns) with the data of multiple months. Is it straight forward to combine all those multiple month;s spreadsheets? Or, do we need to have a mechanism on inserting the data into database and then write queries to slide and dice?
Praveen SreeramPosted Jun 20, 2016, 10:38 PM
That's great. Will wait for your future articles
Priyaranjan K SPosted Jun 20, 2016, 12:06 PM
Good Catch Praveen Kumar Sreeram . Yes I shall add an article on creating Charts using R Plots as well. There are open sourece R Libraries for Web which can be used to integrate R into the Web : http://www.jenunderwood.com/2015/01/12/part-1-integrating-r/
Praveen SreeramPosted Jun 20, 2016, 7:37 AM
Hope you will be showing us a couple of charts in the coming articles..also is it possible to integrate this with a web technology?
Praveen SreeramPosted Jun 20, 2016, 7:32 AM
A small typo.. I think it should be column instead if row in the sentence" The first row is the sequential serial number"
Vignesh ManiPosted Jun 17, 2016, 5:31 AM
Good one
Debasis SahaPosted Jun 17, 2016, 12:49 AM
Nice one..
Guest UserPosted Jun 16, 2016, 7:53 PM
I agree , R or any other Big Data needs statistical background to analyze and work on data.
Mahesh ChandPosted Jun 16, 2016, 8:36 AM
Nice to see a tutorial on R. Good work. Question: Besides language R and Visual Studio, what else do you need? I guess Statistics? Thanks
Manoj KallaPosted Jun 16, 2016, 3:31 AM
Very good introductory article
RajaPosted Jun 16, 2016, 1:59 AM
Good One....