

Now to see the Activity Monitor in SQL Server 2008.
Step 1:
First open the SQL Server 2008.
Step 2:
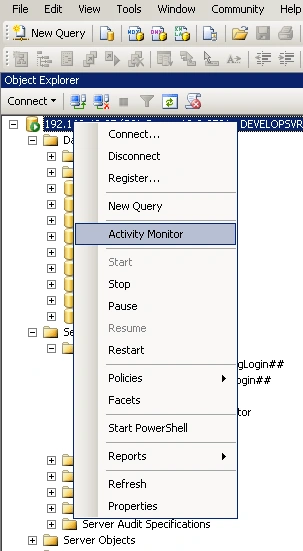
Right-click the SQL Server Engine and click "Activity Monitor".
Step 3:
After clicking that you will see like the following figure:
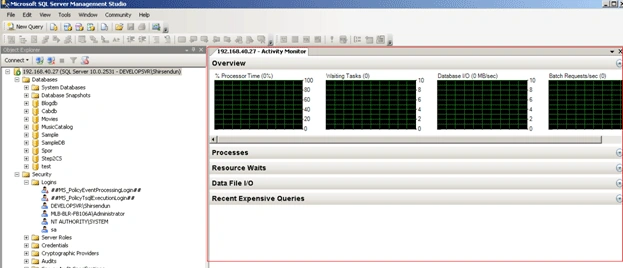
See here you will see the 5 sections.
- Overview
- Process
- Resource Waits
- Data File Io
- Recent Expressive Query
Step 4:
Now I click the Process. It will see like:
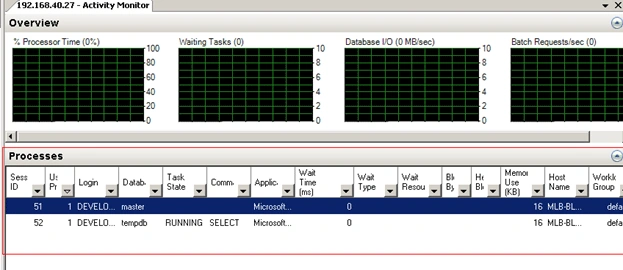
See here you will get the Session id, Database, Task State, Wait time etc information. You can change the resource by clicking the dropdown also.
Step 5:
Now click the Resource Waits it will look like:
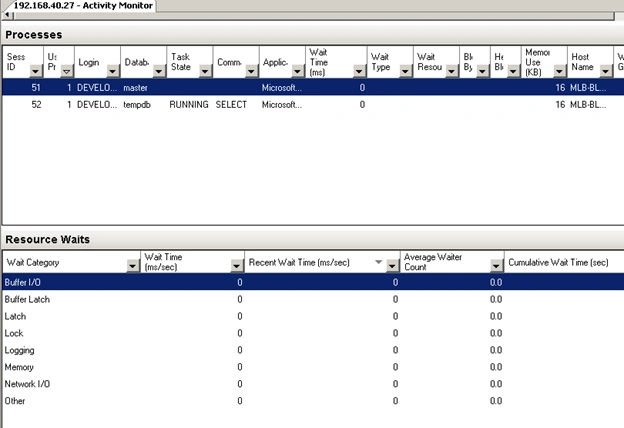
See here you will get all the information of time for the resources being waited on.
Step 6:
Now click the Data File I/O. It will look like:
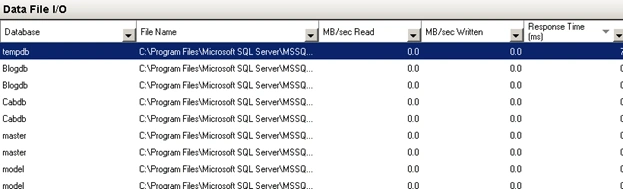
See here you will get all the database names of your SQL Server and the time for data interaction of each database.
Step 7:
Now click the "Recent Expensive Query".
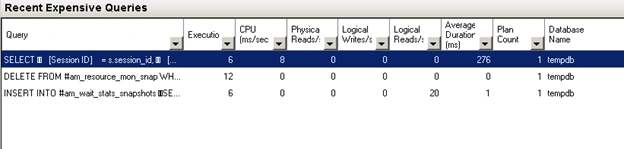
See here you will get the entire query that takes the most time to execute or that takes the most resources. You will get the information of the query execution.
Conclusion: So in this article I have described how to use an Activity Monitor in SQL Server 2008. This process is useful when a web site interacts with SQL Server and you will see what types of resources are taken.
Join the conversation! Your thoughts help the community grow.