Power BI Designer
According to Microsoft:
Power BI Designer is a dedicated report authoring tool for the Power BI Preview service. The Power BI Designer provides rich data transformation and visual analytics in a unified, seamless experience. The Power BI Designer enables you to create impactful reports with state-of-the-art interactive charts, maps, graphs and data transformations. Upload your reports to the Power BI preview and empower others with timely critical insights on any device, anywhere.
Power BI designer is a new standalone Windows Desktop application for creating Power BI that can be downloaded from the official Power BI site.
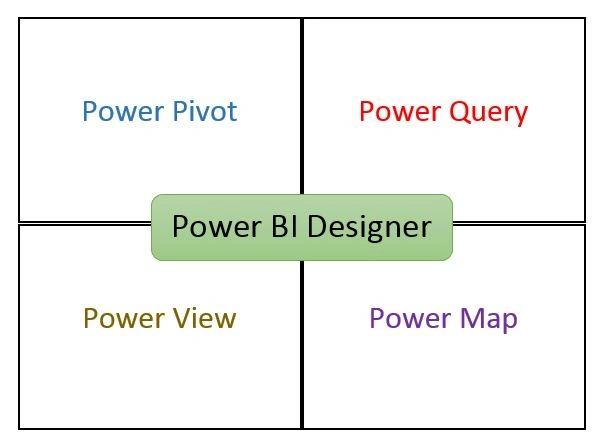
The Power BI Designer helps its customers to build Power BI elements in an offline fashion that combines the power of Power Query, Power Pivot data model, Power View and Power Map into a seamless experience.
You can download the Power BI Designer preview from here.
Use the following procedure to obtain a meaningful data.
Step 1: Connect to a Facebook Page
We will use C# Corner Facebook page to import our data. The following is the link to the page.
CSharpCorner Page
- Open Microsoft Power BI Designer.

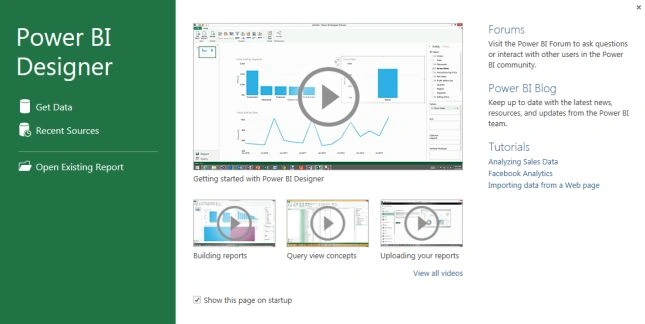
- The Power BI Designer startup page will be loaded. Click on Get Data from the startup page.
- Select Facebook from the Get Data dialog from the wide range of data sources and click on Connect.
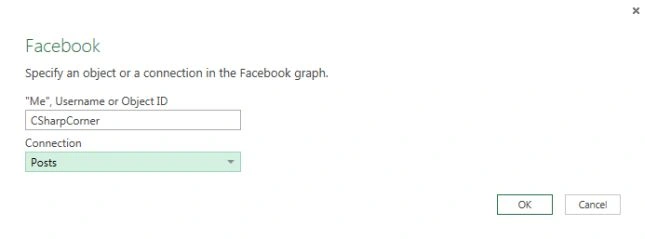
- A new window will be opened. Enter CSharpCorner into the TextBox and select Posts from the Connection drop down list and click on OK.
Note: Here CSharpCorner is the username of the page.
- After successful establishment of the connection to the page, we will see the Query is loading and fetching data from Facebook.

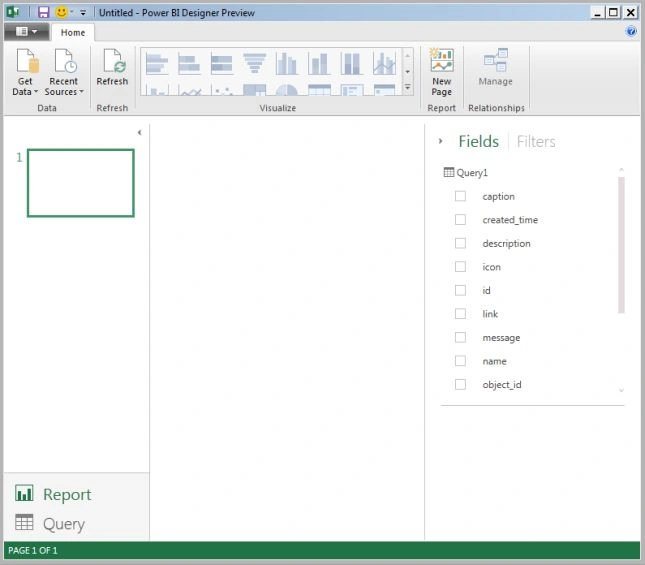
- Once the query is loaded we will be taken to the report view where the columns from the table are listed under the Fields list on the right hand side.
Step 2: Splitting Created_Time Column
As we can see the created_time column contains both the date and time so we need to separate them into two columns, one for date and the other for time.
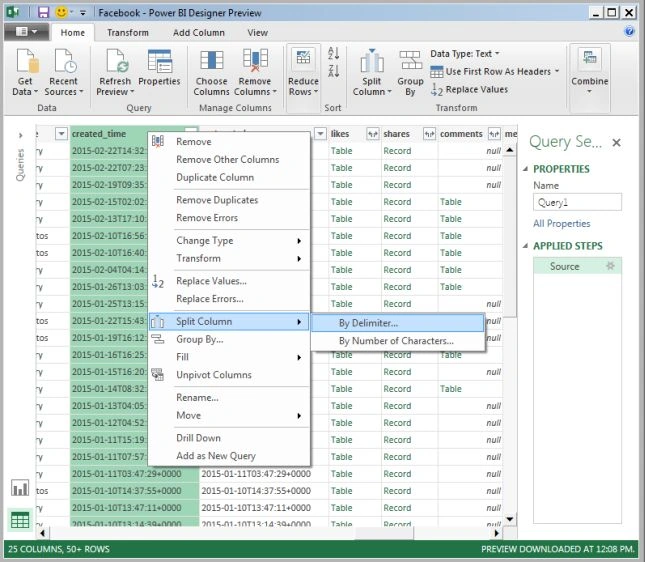
- Select the created_time column and right-click on the column header and click the Split Column -> By Delimiter to split the column.
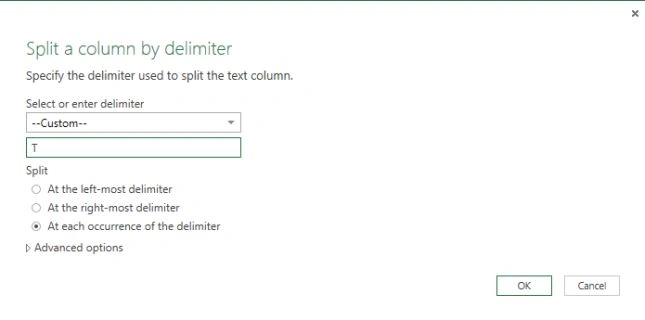
- In the Select or enter delimiter drop down list select the custom option and enter "T" without quotes and click on OK.
- Now rename the two columns as created_date and created_time resepectively.
- Select the new column created_time and from the Transform ribbon tab change the Data Type from Text to Date/Time format.
- Again select the created_time column and navigate to the Add Column ribbon tab and select Time -> Hour under the Date and Time group. This will create a new column named Hour.
- Change the Data Type of the Hour column from Decimal Number to Whole Number from the Transform ribbon tab.
Step 3: Add an aggregate value from a related table
In this step we will add a count of shares to be used in our visualizations from the nested value.
- Search for the shares column in the table and when found click on the
 in the top-right of the column header. It will open a new popup window, select the count from that window and click on OK.
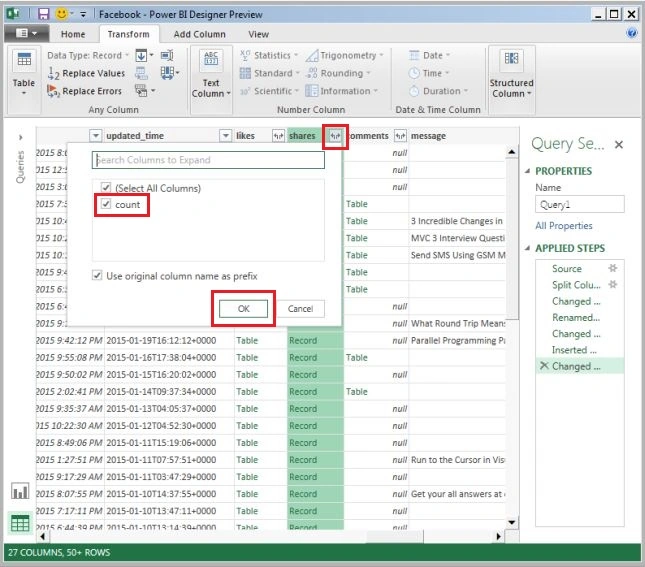
- Now rename the column to shares by right-clicking on the header of the column and click on Rename.
- Change the Data Type of the shares column from Any to Whole Number from the Transform ribbon tab.
Step 4: Creating a Treemap Visualization
- Click on the Reports from the bottom left hand side, it will open the reports page and the query will start to load.
- Drag the Type column from the Fields list to the report canvas that will create a visualization in the report canvas.
- Change the type of visualization to Treemap visualization.
- Drag the id field into the Values section.
This will create the Treemap visualization as shown below.
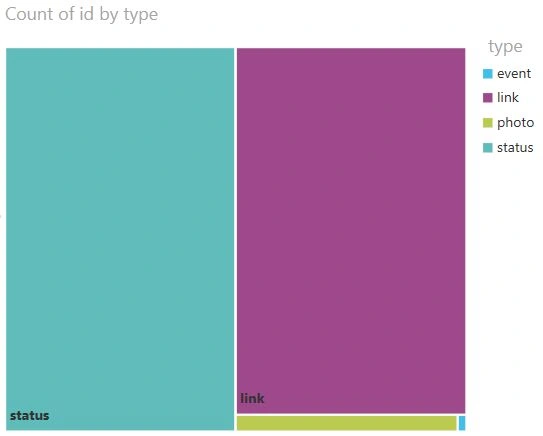
This analysis represents the various types of posts, posted by the CSharpCorner on the Facebook page that can be a post with a link, a post having photos and so on and a post with event description.
Step 5: Creating a Line Chart Visualization
- Drag the created_date column from the Fields list into the report canvas.
- Drag the shares column into the Values section under the field list at the right hand side.
This will create the Line Chart visualization as shown below.
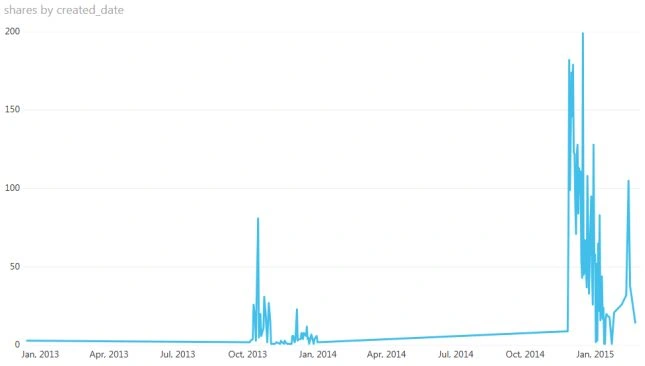
This analysis represents the posts shared by the users, posted by the CSharpCorner on Facebook per month.
Step 6: Creating Bar Chart Visualization
- Drag and drop the shares column into the report canvas from the Fields list.
- Drag and drop the Hour column into the Axis section under the Fields list.
- Now change the type of visualization to Bar Chart visualization.
- Right-click on the chart and change the Sort order and sort by Hour in ascending order ( A -> Z).
This will create the Bar Chart visualization as shown below.
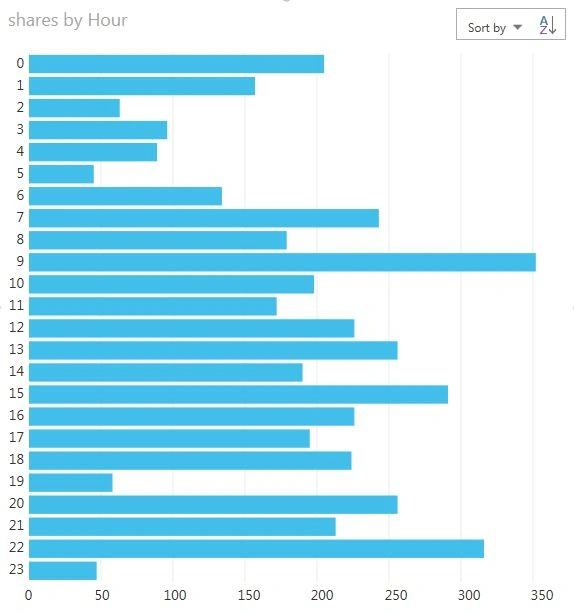
This analysis represents the number of posts shared by the people per hour.
Summary
As we can see it is very easy to customize the visualizations in our report that can represent the data in many ways. Power BI designer can get data from a wide range of data sources and shaping it to meet the analysis needs to visualize this data in rich and interactive ways.


Miguel AcostaPosted Jul 8, 2016, 1:17 PM
Very usefull, I was wondering if you've done geographic analysis with Facebook graph api and power bi. I am stocked in the "Custom" connection of the power BI Get Data option.
Kashif SohailPosted Mar 13, 2016, 10:59 AM
Nice
Chiheb ChebbiPosted Feb 24, 2015, 5:54 PM
This is really Great
Rahul Kumar SaxenaPosted Feb 24, 2015, 7:17 AM
Nice one...
Sibeesh VenuPosted Feb 24, 2015, 2:15 AM
Abhishek Arora You are welcome.
Sibeesh VenuPosted Feb 24, 2015, 1:32 AM
Good one.