

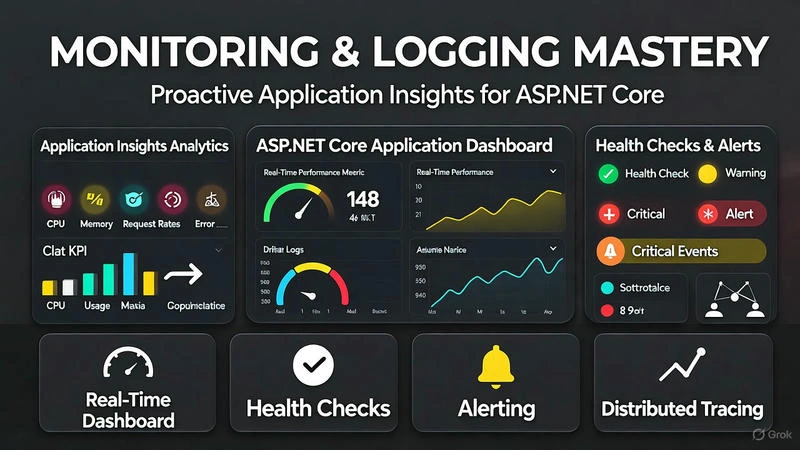
Table of Contents
The Critical Role of Monitoring in Modern Applications
Setting Up Comprehensive Logging Infrastructure
Application Insights Deep Dive
Advanced Health Check Systems
Real-Time Monitoring Dashboards
Distributed Tracing & Correlation
Performance Counters & Metrics
Alerting & Notification Systems
Security Monitoring & Compliance
Production Deployment & Best Practices
1. The Critical Role of Monitoring in Modern Applications
Why Monitoring is Non-Negotiable in Production
In today's digital landscape, application downtime or performance degradation can result in significant revenue loss, damaged reputation, and customer churn. Comprehensive monitoring provides:
Business Impact Visibility
Real-time performance metrics
User experience monitoring
Business transaction tracking
Revenue impact analysis
Technical Operations
Proactive issue detection
Rapid root cause analysis
Capacity planning insights
Security threat detection
Real-World Monitoring Disaster Stories
Case Study: E-Commerce Outage
A major retailer lost $100,000 per hour during a 6-hour outage that could have been prevented with proper monitoring. Missing database connection pool monitoring led to cascading failures.
Case Study: Financial Service Incident
A trading platform experienced 15 minutes of latency spikes, resulting in $2M in lost trades. Inadequate distributed tracing made root cause analysis take days instead of minutes.
The Monitoring Maturity Model
    // Monitoring maturity assessment
public class MonitoringMaturity
{
    public Level CurrentLevel { get; set; }

    public enum Level
    {
        Reactive,       // Basic error logging
        Proactive,      // Performance monitoring
        Predictive,     // AI-driven insights
        Autonomous      // Self-healing systems
    }

    public bool AssessMaturity(ApplicationMetrics metrics)
    {
        return metrics switch
        {
            { HasStructuredLogging: true, HasHealthChecks: true } => Level.Proactive,
            { HasDistributedTracing: true, HasRealTimeAlerting: true } => Level.Predictive,
            { HasAIOps: true, HasAutoRemediation: true } => Level.Autonomous,
            _ => Level.Reactive
        };
    }
}
2. Setting Up Comprehensive Logging Infrastructure
Structured Logging with Serilog
    // Program.cs - Advanced Logging Configuration
using Serilog;
using Serilog.Events;
using Serilog.Sinks.ApplicationInsights;

var builder = WebApplication.CreateBuilder(args);

// Configure Serilog
Log.Logger = new LoggerConfiguration()
    .ReadFrom.Configuration(builder.Configuration)
    .Enrich.FromLogContext()
    .Enrich.WithProperty("Application", "ECommerceApp")
    .Enrich.WithProperty("Environment", builder.Environment.EnvironmentName)
    .Enrich.WithMachineName()
    .Enrich.WithThreadId()
    .WriteTo.Console(
        outputTemplate: "[{Timestamp:HH:mm:ss} {Level:u3}] {Message:lj} {Properties:j}{NewLine}{Exception}")
    .WriteTo.File(
        path: "logs/app-.log",
        rollingInterval: RollingInterval.Day,
        retainedFileCountLimit: 30,
        outputTemplate: "{Timestamp:yyyy-MM-dd HH:mm:ss.fff zzz} [{Level:u3}] {Message:lj} {Properties:j}{NewLine}{Exception}")
    .WriteTo.ApplicationInsights(
        builder.Configuration["ApplicationInsights:ConnectionString"],
        TelemetryConverter.Traces)
    .WriteTo.Seq("http://localhost:5341")
    .CreateLogger();

builder.Host.UseSerilog();

// Add services
builder.Services.AddControllers();
builder.Services.AddHealthChecks();

var app = builder.Build();

// Log application startup
Log.Information("Application starting up at {StartupTime} with environment {Environment}",
    DateTime.UtcNow, app.Environment.EnvironmentName);

app.UseRouting();
app.UseAuthorization();
app.MapControllers();
app.MapHealthChecks("/health");

try
{
    Log.Information("Starting web host");
    app.Run();
}
catch (Exception ex)
{
    Log.Fatal(ex, "Host terminated unexpectedly");
}
finally
{
    Log.CloseAndFlush();
}
Advanced Logging Service with Context Enrichment
    // Services/AdvancedLoggingService.cs
public interface IAdvancedLogger
{
    IDisposable BeginScope<TState>(TState state);
    void LogCritical(string message, params object[] properties);
    void LogError(string message, params object[] properties);
    void LogWarning(string message, params object[] properties);
    void LogInformation(string message, params object[] properties);
    void LogDebug(string message, params object[] properties);
    void LogPerformance(string operation, TimeSpan duration, Dictionary<string, object> context = null);
    void LogBusinessEvent(string eventType, Dictionary<string, object> metrics);
}

public class AdvancedLogger : IAdvancedLogger
{
    private readonly ILogger<AdvancedLogger> _logger;
    private readonly IHttpContextAccessor _httpContextAccessor;

    public AdvancedLogger(ILogger<AdvancedLogger> logger, IHttpContextAccessor httpContextAccessor)
    {
        _logger = logger;
        _httpContextAccessor = httpContextAccessor;
    }

    public IDisposable BeginScope<TState>(TState state)
    {
        return _logger.BeginScope(state);
    }

    public void LogCritical(string message, params object[] properties)
    {
        var enrichedProperties = EnrichWithContext(properties);
        _logger.LogCritical(message, enrichedProperties);
    }

    public void LogError(string message, params object[] properties)
    {
        var enrichedProperties = EnrichWithContext(properties);
        _logger.LogError(message, enrichedProperties);
    }

    public void LogWarning(string message, params object[] properties)
    {
        var enrichedProperties = EnrichWithContext(properties);
        _logger.LogWarning(message, enrichedProperties);
    }

    public void LogInformation(string message, params object[] properties)
    {
        var enrichedProperties = EnrichWithContext(properties);
        _logger.LogInformation(message, enrichedProperties);
    }

    public void LogDebug(string message, params object[] properties)
    {
        var enrichedProperties = EnrichWithContext(properties);
        _logger.LogDebug(message, enrichedProperties);
    }

    public void LogPerformance(string operation, TimeSpan duration, Dictionary<string, object> context = null)
    {
        var properties = new Dictionary<string, object>
        {
            ["Operation"] = operation,
            ["DurationMs"] = duration.TotalMilliseconds,
            ["IsSlow"] = duration.TotalMilliseconds > 1000 // 1 second threshold
        };

        if (context != null)
        {
            foreach (var item in context)
            {
                properties[item.Key] = item.Value;
            }
        }

        var enrichedProperties = EnrichWithContext(properties.Values.ToArray());

        if (duration.TotalMilliseconds > 1000)
        {
            _logger.LogWarning("Performance alert: {Operation} took {DurationMs}ms", operation, duration.TotalMilliseconds);
        }
        else
        {
            _logger.LogInformation("Performance: {Operation} completed in {DurationMs}ms", operation, duration.TotalMilliseconds);
        }
    }

    public void LogBusinessEvent(string eventType, Dictionary<string, object> metrics)
    {
        var properties = new Dictionary<string, object>
        {
            ["EventType"] = eventType,
            ["Timestamp"] = DateTime.UtcNow
        };

        foreach (var metric in metrics)
        {
            properties[metric.Key] = metric.Value;
        }

        var enrichedProperties = EnrichWithContext(properties.Values.ToArray());
        _logger.LogInformation("Business Event: {EventType} with metrics {@Metrics}", eventType, metrics);
    }

    private object[] EnrichWithContext(object[] properties)
    {
        var context = _httpContextAccessor.HttpContext;
        var enrichedList = properties.ToList();

        if (context != null)
        {
            // Add correlation ID
            var correlationId = context.Request.Headers["X-Correlation-ID"].FirstOrDefault()
                              ?? Guid.NewGuid().ToString();
            enrichedList.Add(correlationId);

            // Add user context
            var userId = context.User.FindFirst("sub")?.Value ?? "anonymous";
            enrichedList.Add(userId);

            // Add request path
            enrichedList.Add(context.Request.Path);
        }

        return enrichedList.ToArray();
    }
}

// Example usage in controller
[ApiController]
[Route("api/[controller]")]
public class OrdersController : ControllerBase
{
    private readonly IAdvancedLogger _logger;
    private readonly IOrderService _orderService;

    public OrdersController(IAdvancedLogger logger, IOrderService orderService)
    {
        _logger = logger;
        _orderService = orderService;
    }

    [HttpPost]
    public async Task<ActionResult<Order>> CreateOrder([FromBody] CreateOrderRequest request)
    {
        using (_logger.BeginScope(new { OrderRequest = request, UserId = User.Identity.Name }))
        {
            var stopwatch = Stopwatch.StartNew();

            try
            {
                _logger.LogInformation("Creating order for user {UserId} with {ItemCount} items",
                    User.Identity.Name, request.Items.Count);

                var order = await _orderService.CreateOrderAsync(request);

                stopwatch.Stop();
                _logger.LogPerformance("CreateOrder", stopwatch.Elapsed, new Dictionary<string, object>
                {
                    ["OrderId"] = order.Id,
                    ["TotalAmount"] = order.TotalAmount,
                    ["ItemCount"] = request.Items.Count
                });

                // Log business event
                _logger.LogBusinessEvent("OrderCreated", new Dictionary<string, object>
                {
                    ["OrderId"] = order.Id,
                    ["CustomerId"] = User.Identity.Name,
                    ["TotalAmount"] = order.TotalAmount,
                    ["ItemsCount"] = order.Items.Count,
                    ["PaymentMethod"] = request.PaymentMethod
                });

                return Ok(order);
            }
            catch (Exception ex)
            {
                stopwatch.Stop();
                _logger.LogError(ex, "Failed to create order for user {UserId}", User.Identity.Name);

                _logger.LogBusinessEvent("OrderCreationFailed", new Dictionary<string, object>
                {
                    ["Error"] = ex.Message,
                    ["UserId"] = User.Identity.Name,
                    ["DurationMs"] = stopwatch.ElapsedMilliseconds
                });

                return BadRequest(new { error = "Order creation failed" });
            }
        }
    }
}
Configuration for Production Logging
    // appsettings.Production.json
{
  "Serilog": {
    "Using": [
      "Serilog.Sinks.Console",
      "Serilog.Sinks.File",
      "Serilog.Sinks.ApplicationInsights"
    ],
    "MinimumLevel": {
      "Default": "Information",
      "Override": {
        "Microsoft": "Warning",
        "System": "Warning",
        "Microsoft.AspNetCore": "Warning",
        "Microsoft.EntityFrameworkCore": "Warning"
      }
    },
    "WriteTo": [
      {
        "Name": "Console",
        "Args": {
          "outputTemplate": "[{Timestamp:HH:mm:ss} {Level:u3}] {Message:lj} <s:{SourceContext}>{NewLine}{Exception}"
        }
      },
      {
        "Name": "File",
        "Args": {
          "path": "/var/log/app/app-.log",
          "rollingInterval": "Day",
          "retainedFileCountLimit": 30,
          "outputTemplate": "{Timestamp:yyyy-MM-dd HH:mm:ss.fff zzz} [{Level:u3}] {Message:lj} {Properties:j}{NewLine}{Exception}"
        }
      },
      {
        "Name": "ApplicationInsights",
        "Args": {
          "connectionString": "InstrumentationKey=your-key-here;IngestionEndpoint=https://eastus-8.in.applicationinsights.azure.com/",
          "telemetryConverter": "Serilog.Sinks.ApplicationInsights.TelemetryConverters.TraceTelemetryConverter"
        }
      },
      {
        "Name": "Seq",
        "Args": {
          "serverUrl": "http://seq:5341"
        }
      }
    ],
    "Enrich": [
      "FromLogContext",
      "WithMachineName",
      "WithThreadId",
      "WithAssemblyName",
      "WithAssemblyVersion"
    ],
    "Properties": {
      "Application": "ECommercePlatform",
      "Environment": "Production"
    }
  },
  "Logging": {
    "LogLevel": {
      "Default": "Information",
      "Microsoft.AspNetCore": "Warning",
      "Microsoft.EntityFrameworkCore.Database.Command": "Warning"
    }
  }
}
3. Application Insights Deep Dive
Comprehensive Application Insights Setup
    // Program.cs - Application Insights Configuration
using Microsoft.ApplicationInsights.Extensibility;
using Microsoft.ApplicationInsights.AspNetCore;

var builder = WebApplication.CreateBuilder(args);

// Add Application Insights
builder.Services.AddApplicationInsightsTelemetry(options =>
{
    options.ConnectionString = builder.Configuration["ApplicationInsights:ConnectionString"];
    options.EnableAdaptiveSampling = false; // We want all telemetry for critical apps
    options.EnablePerformanceCounterCollectionModule = true;
    options.EnableQuickPulseMetricStream = true;
    options.EnableDiagnosticsTelemetryModule = true;
    options.EnableAzureInstanceMetadataTelemetryModule = true;
});

// Additional telemetry processors
builder.Services.AddApplicationInsightsTelemetryProcessor<CustomTelemetryProcessor>();
builder.Services.AddSingleton<ITelemetryInitializer, CustomTelemetryInitializer>();

// Add distributed tracing
builder.Services.AddDistributedTracing();

var app = builder.Build();

// Custom telemetry initializer
public class CustomTelemetryInitializer : ITelemetryInitializer
{
    private readonly IHttpContextAccessor _httpContextAccessor;

    public CustomTelemetryInitializer(IHttpContextAccessor httpContextAccessor)
    {
        _httpContextAccessor = httpContextAccessor;
    }

    public void Initialize(ITelemetry telemetry)
    {
        var context = _httpContextAccessor.HttpContext;

        if (context != null)
        {
            // Add correlation ID
            var correlationId = context.Request.Headers["X-Correlation-ID"].FirstOrDefault();
            if (!string.IsNullOrEmpty(correlationId))
            {
                telemetry.Context.Operation.Id = correlationId;
            }

            // Add user context
            var userId = context.User.Identity.Name;
            if (!string.IsNullOrEmpty(userId))
            {
                telemetry.Context.User.Id = userId;
                telemetry.Context.User.AuthenticatedUserId = userId;
            }

            // Add business context
            telemetry.Context.GlobalProperties["BusinessUnit"] = "ECommerce";
            telemetry.Context.GlobalProperties["ApplicationVersion"] = "1.2.3";

            // Add custom properties based on request
            if (context.Request.Path.HasValue)
            {
                telemetry.Context.GlobalProperties["RequestPath"] = context.Request.Path.Value;
            }
        }
    }
}

// Custom telemetry processor for filtering
public class CustomTelemetryProcessor : ITelemetryProcessor
{
    private readonly ITelemetryProcessor _next;

    public CustomTelemetryProcessor(ITelemetryProcessor next)
    {
        _next = next;
    }

    public void Process(ITelemetry item)
    {
        // Filter out health check requests from metric collection
        if (item is RequestTelemetry request &&
            request.Url.ToString().Contains("/health"))
        {
            return;
        }

        // Filter out noisy dependencies
        if (item is DependencyTelemetry dependency &&
            dependency.Type == "HTTP" &&
            dependency.Duration < TimeSpan.FromMilliseconds(100))
        {
            return;
        }

        // Add custom properties to all telemetry
        item.Context.GlobalProperties["ProcessingTimestamp"] = DateTime.UtcNow.ToString("O");

        _next.Process(item);
    }
}
Custom Telemetry Service
    // Services/TelemetryService.cs
public interface ITelemetryService
{
    void TrackEvent(string eventName, Dictionary<string, string> properties = null, Dictionary<string, double> metrics = null);
    void TrackException(Exception exception, Dictionary<string, string> properties = null);
    void TrackMetric(string metricName, double value, Dictionary<string, string> properties = null);
    void TrackDependency(string dependencyType, string dependencyName, string data, DateTimeOffset startTime, TimeSpan duration, bool success);
    void TrackRequest(string name, DateTimeOffset startTime, TimeSpan duration, string responseCode, bool success);
    void TrackAvailability(string name, DateTimeOffset timeStamp, TimeSpan duration, string runLocation, bool success, string message = null);
    void TrackBusinessMetric(string metricName, double value, string category, Dictionary<string, string> dimensions = null);
}

public class ApplicationInsightsTelemetryService : ITelemetryService
{
    private readonly TelemetryClient _telemetryClient;
    private readonly ILogger<ApplicationInsightsTelemetryService> _logger;

    public ApplicationInsightsTelemetryService(TelemetryClient telemetryClient, ILogger<ApplicationInsightsTelemetryService> logger)
    {
        _telemetryClient = telemetryClient;
        _logger = logger;
    }

    public void TrackEvent(string eventName, Dictionary<string, string> properties = null, Dictionary<string, double> metrics = null)
    {
        try
        {
            _telemetryClient.TrackEvent(eventName, properties, metrics);
            _logger.LogDebug("Tracked event: {EventName}", eventName);
        }
        catch (Exception ex)
        {
            _logger.LogWarning(ex, "Failed to track event: {EventName}", eventName);
        }
    }

    public void TrackException(Exception exception, Dictionary<string, string> properties = null)
    {
        try
        {
            var telemetry = new ExceptionTelemetry(exception);
            if (properties != null)
            {
                foreach (var prop in properties)
                {
                    telemetry.Properties[prop.Key] = prop.Value;
                }
            }

            _telemetryClient.TrackException(telemetry);
            _logger.LogDebug("Tracked exception: {ExceptionType}", exception.GetType().Name);
        }
        catch (Exception ex)
        {
            _logger.LogWarning(ex, "Failed to track exception");
        }
    }

    public void TrackMetric(string metricName, double value, Dictionary<string, string> properties = null)
    {
        try
        {
            var metric = new MetricTelemetry(metricName, value);
            if (properties != null)
            {
                foreach (var prop in properties)
                {
                    metric.Properties[prop.Key] = prop.Value;
                }
            }

            _telemetryClient.TrackMetric(metric);
        }
        catch (Exception ex)
        {
            _logger.LogWarning(ex, "Failed to track metric: {MetricName}", metricName);
        }
    }

    public void TrackDependency(string dependencyType, string dependencyName, string data, DateTimeOffset startTime, TimeSpan duration, bool success)
    {
        try
        {
            _telemetryClient.TrackDependency(dependencyType, dependencyName, data, startTime, duration, success);
        }
        catch (Exception ex)
        {
            _logger.LogWarning(ex, "Failed to track dependency: {DependencyName}", dependencyName);
        }
    }

    public void TrackRequest(string name, DateTimeOffset startTime, TimeSpan duration, string responseCode, bool success)
    {
        try
        {
            _telemetryClient.TrackRequest(name, startTime, duration, responseCode, success);
        }
        catch (Exception ex)
        {
            _logger.LogWarning(ex, "Failed to track request: {RequestName}", name);
        }
    }

    public void TrackAvailability(string name, DateTimeOffset timeStamp, TimeSpan duration, string runLocation, bool success, string message = null)
    {
        try
        {
            _telemetryClient.TrackAvailability(name, timeStamp, duration, runLocation, success, message);
        }
        catch (Exception ex)
        {
            _logger.LogWarning(ex, "Failed to track availability: {AvailabilityTestName}", name);
        }
    }

    public void TrackBusinessMetric(string metricName, double value, string category, Dictionary<string, string> dimensions = null)
    {
        try
        {
            var properties = new Dictionary<string, string>
            {
                ["Category"] = category,
                ["BusinessMetric"] = "true"
            };

            if (dimensions != null)
            {
                foreach (var dimension in dimensions)
                {
                    properties[dimension.Key] = dimension.Value;
                }
            }

            TrackMetric(metricName, value, properties);

            _logger.LogInformation("Business metric tracked: {MetricName}={Value} in category {Category}",
                metricName, value, category);
        }
        catch (Exception ex)
        {
            _logger.LogWarning(ex, "Failed to track business metric: {MetricName}", metricName);
        }
    }
}

// Example usage in business service
public class OrderService : IOrderService
{
    private readonly ITelemetryService _telemetry;
    private readonly IAdvancedLogger _logger;

    public OrderService(ITelemetryService telemetry, IAdvancedLogger logger)
    {
        _telemetry = telemetry;
        _logger = logger;
    }

    public async Task<Order> ProcessOrderAsync(Order order)
    {
        var stopwatch = Stopwatch.StartNew();

        try
        {
            // Track business event
            _telemetry.TrackEvent("OrderProcessingStarted", new Dictionary<string, string>
            {
                ["OrderId"] = order.Id.ToString(),
                ["CustomerId"] = order.CustomerId,
                ["TotalAmount"] = order.TotalAmount.ToString("C"),
                ["ItemCount"] = order.Items.Count.ToString()
            });

            // Business logic
            await ValidateOrderAsync(order);
            await ProcessPaymentAsync(order);
            await UpdateInventoryAsync(order);
            await SendConfirmationAsync(order);

            // Track success metrics
            _telemetry.TrackBusinessMetric("OrdersProcessed", 1, "Revenue");
            _telemetry.TrackBusinessMetric("Revenue", order.TotalAmount, "Revenue");

            stopwatch.Stop();

            // Track performance
            _telemetry.TrackMetric("OrderProcessingTime", stopwatch.ElapsedMilliseconds);

            _logger.LogInformation("Order {OrderId} processed successfully in {ProcessingTime}ms",
                order.Id, stopwatch.ElapsedMilliseconds);

            return order;
        }
        catch (Exception ex)
        {
            stopwatch.Stop();

            // Track failure
            _telemetry.TrackException(ex, new Dictionary<string, string>
            {
                ["OrderId"] = order.Id.ToString(),
                ["ProcessingTime"] = stopwatch.ElapsedMilliseconds.ToString()
            });

            _telemetry.TrackBusinessMetric("OrderProcessingFailed", 1, "Errors");

            _logger.LogError(ex, "Failed to process order {OrderId}", order.Id);

            throw;
        }
    }
}
4. Advanced Health Check Systems
Comprehensive Health Check Setup
    // Program.cs - Health Checks Configuration
using Microsoft.Extensions.Diagnostics.HealthChecks;

var builder = WebApplication.CreateBuilder(args);

// Add basic health checks
builder.Services.AddHealthChecks()
    .AddCheck("self", () => HealthCheckResult.Healthy(), tags: new[] { "ready" })
    .AddSqlServer(
        connectionString: builder.Configuration.GetConnectionString("DefaultConnection"),
        name: "sql",
        failureStatus: HealthStatus.Unhealthy,
        tags: new[] { "ready", "database" })
    .AddRedis(
        redisConnectionString: builder.Configuration.GetConnectionString("Redis"),
        name: "redis",
        failureStatus: HealthStatus.Degraded,
        tags: new[] { "ready", "cache" })
    .AddAzureBlobStorage(
        connectionString: builder.Configuration.GetConnectionString("AzureStorage"),
        name: "blobstorage",
        failureStatus: HealthStatus.Degraded,
        tags: new[] { "ready", "storage" })
    .AddApplicationInsightsPublisher();

// Add custom health checks
builder.Services.AddHealthChecks()
    .AddCheck<DatabaseHealthCheck>("database_advanced", tags: new[] { "detailed" })
    .AddCheck<ExternalApiHealthCheck>("external_api", tags: new[] { "external" })
    .AddCheck<DiskSpaceHealthCheck>("disk_space", tags: new[] { "infrastructure" });

// Configure health check UI
builder.Services.AddHealthChecksUI(settings =>
{
    settings.SetHeaderText("ECommerce Platform - Health Status");
    settings.AddHealthCheckEndpoint("API", "/health");
    settings.AddHealthCheckEndpoint("Database", "/health/database");
    settings.AddHealthCheckEndpoint("External Services", "/health/external");
    settings.SetEvaluationTimeInSeconds(60);
    settings.SetApiMaxActiveRequests(3);
    settings.MaximumHistoryEntriesPerEndpoint(50);
})
.AddInMemoryStorage();

var app = builder.Build();

// Map health check endpoints
app.MapHealthChecks("/health", new HealthCheckOptions
{
    Predicate = _ => true,
    ResponseWriter = WriteResponse,
    AllowCachingResponses = false
});

app.MapHealthChecks("/health/ready", new HealthCheckOptions
{
    Predicate = check => check.Tags.Contains("ready"),
    ResponseWriter = WriteResponse
});

app.MapHealthChecks("/health/database", new HealthCheckOptions
{
    Predicate = check => check.Tags.Contains("database"),
    ResponseWriter = WriteResponse
});

app.MapHealthChecks("/health/external", new HealthCheckOptions
{
    Predicate = check => check.Tags.Contains("external"),
    ResponseWriter = WriteResponse
});

// Health checks UI
app.MapHealthChecksUI(options =>
{
    options.UIPath = "/health-ui";
    options.AddCustomStylesheet("wwwroot/custom-health.css");
});

// Custom response writer
static Task WriteResponse(HttpContext context, HealthReport result)
{
    context.Response.ContentType = "application/json; charset=utf-8";

    var response = new
    {
        status = result.Status.ToString(),
        totalDuration = result.TotalDuration.TotalMilliseconds,
        checks = result.Entries.Select(entry => new
        {
            name = entry.Key,
            status = entry.Value.Status.ToString(),
            duration = entry.Value.Duration.TotalMilliseconds,
            description = entry.Value.Description,
            exception = entry.Value.Exception?.Message,
            data = entry.Value.Data
        })
    };

    var json = JsonSerializer.Serialize(response, new JsonSerializerOptions
    {
        WriteIndented = true,
        PropertyNamingPolicy = JsonNamingPolicy.CamelCase
    });

    return context.Response.WriteAsync(json);
}

// Custom health check implementations
public class DatabaseHealthCheck : IHealthCheck
{
    private readonly IConfiguration _configuration;
    private readonly ILogger<DatabaseHealthCheck> _logger;

    public DatabaseHealthCheck(IConfiguration configuration, ILogger<DatabaseHealthCheck> logger)
    {
        _configuration = configuration;
        _logger = logger;
    }

    public async Task<HealthCheckResult> CheckHealthAsync(HealthCheckContext context, CancellationToken cancellationToken = default)
    {
        var stopwatch = Stopwatch.StartNew();

        try
        {
            var connectionString = _configuration.GetConnectionString("DefaultConnection");

            using var connection = new SqlConnection(connectionString);
            await connection.OpenAsync(cancellationToken);

            // Check basic connectivity
            var canConnect = connection.State == ConnectionState.Open;
            if (!canConnect)
            {
                return HealthCheckResult.Unhealthy("Cannot connect to database");
            }

            // Check critical tables exist
            var tablesCheck = await connection.QueryFirstOrDefaultAsync<int>(
                "SELECT COUNT(*) FROM INFORMATION_SCHEMA.TABLES WHERE TABLE_NAME IN ('Orders', 'Products', 'Customers')");

            if (tablesCheck < 3)
            {
                return HealthCheckResult.Degraded("Some critical tables are missing");
            }

            // Check performance with a simple query
            var performanceStopwatch = Stopwatch.StartNew();
            await connection.ExecuteScalarAsync<int>("SELECT COUNT(*) FROM Orders");
            performanceStopwatch.Stop();

            var data = new Dictionary<string, object>
            {
                ["connection_time_ms"] = stopwatch.ElapsedMilliseconds,
                ["query_performance_ms"] = performanceStopwatch.ElapsedMilliseconds,
                ["database_name"] = connection.Database,
                ["server"] = connection.DataSource
            };

            if (performanceStopwatch.ElapsedMilliseconds > 1000)
            {
                _logger.LogWarning("Database performance check took {ElapsedMs}ms", performanceStopwatch.ElapsedMilliseconds);
                return HealthCheckResult.Degraded("Database performance is slow", data: data);
            }

            stopwatch.Stop();
            _logger.LogInformation("Database health check completed in {ElapsedMs}ms", stopwatch.ElapsedMilliseconds);

            return HealthCheckResult.Healthy("Database is healthy", data);
        }
        catch (Exception ex)
        {
            stopwatch.Stop();
            _logger.LogError(ex, "Database health check failed after {ElapsedMs}ms", stopwatch.ElapsedMilliseconds);

            return HealthCheckResult.Unhealthy(
                "Database health check failed",
                exception: ex,
                data: new Dictionary<string, object> { ["failure_time_ms"] = stopwatch.ElapsedMilliseconds });
        }
    }
}

public class ExternalApiHealthCheck : IHealthCheck
{
    private readonly HttpClient _httpClient;
    private readonly ILogger<ExternalApiHealthCheck> _logger;

    public ExternalApiHealthCheck(HttpClient httpClient, ILogger<ExternalApiHealthCheck> logger)
    {
        _httpClient = httpClient;
        _logger = logger;
    }

    public async Task<HealthCheckResult> CheckHealthAsync(HealthCheckContext context, CancellationToken cancellationToken = default)
    {
        var stopwatch = Stopwatch.StartNew();
        var results = new List<string>();

        try
        {
            // Check payment gateway
            var paymentGatewayResult = await CheckPaymentGatewayAsync(cancellationToken);
            results.Add($"Payment Gateway: {paymentGatewayResult}");

            // Check shipping service
            var shippingServiceResult = await CheckShippingServiceAsync(cancellationToken);
            results.Add($"Shipping Service: {shippingServiceResult}");

            // Check email service
            var emailServiceResult = await CheckEmailServiceAsync(cancellationToken);
            results.Add($"Email Service: {emailServiceResult}");

            var failedChecks = results.Count(r => r.Contains("Unhealthy"));
            var degradedChecks = results.Count(r => r.Contains("Degraded"));

            stopwatch.Stop();

            var data = new Dictionary<string, object>
            {
                ["total_external_checks"] = results.Count,
                ["failed_checks"] = failedChecks,
                ["degraded_checks"] = degradedChecks,
                ["check_duration_ms"] = stopwatch.ElapsedMilliseconds,
                ["detailed_results"] = results
            };

            if (failedChecks > 0)
            {
                return HealthCheckResult.Unhealthy($"{failedChecks} external services are unhealthy", data: data);
            }

            if (degradedChecks > 0)
            {
                return HealthCheckResult.Degraded($"{degradedChecks} external services are degraded", data: data);
            }

            return HealthCheckResult.Healthy("All external services are healthy", data);
        }
        catch (Exception ex)
        {
            stopwatch.Stop();
            _logger.LogError(ex, "External API health check failed");

            return HealthCheckResult.Unhealthy("External API health check failed", ex);
        }
    }

    private async Task<string> CheckPaymentGatewayAsync(CancellationToken cancellationToken)
    {
        try
        {
            var response = await _httpClient.GetAsync("https://api.paymentgateway.com/health", cancellationToken);

            if (response.IsSuccessStatusCode)
            {
                return "Healthy";
            }
            else if ((int)response.StatusCode >= 500)
            {
                return "Unhealthy";
            }
            else
            {
                return "Degraded";
            }
        }
        catch (Exception ex)
        {
            _logger.LogWarning(ex, "Payment gateway health check failed");
            return "Unhealthy";
        }
    }

    private async Task<string> CheckShippingServiceAsync(CancellationToken cancellationToken)
    {
        // Similar implementation for shipping service
        return "Healthy";
    }

    private async Task<string> CheckEmailServiceAsync(CancellationToken cancellationToken)
    {
        // Similar implementation for email service
        return "Healthy";
    }
}

public class DiskSpaceHealthCheck : IHealthCheck
{
    private readonly ILogger<DiskSpaceHealthCheck> _logger;

    public DiskSpaceHealthCheck(ILogger<DiskSpaceHealthCheck> logger)
    {
        _logger = logger;
    }

    public Task<HealthCheckResult> CheckHealthAsync(HealthCheckContext context, CancellationToken cancellationToken = default)
    {
        try
        {
            var drive = new DriveInfo(Path.GetPathRoot(Environment.CurrentDirectory));

            var availableFreeSpaceGB = drive.AvailableFreeSpace / 1024 / 1024 / 1024;
            var totalSizeGB = drive.TotalSize / 1024 / 1024 / 1024;
            var usedPercentage = (double)(drive.TotalSize - drive.AvailableFreeSpace) / drive.TotalSize * 100;

            var data = new Dictionary<string, object>
            {
                ["available_gb"] = availableFreeSpaceGB,
                ["total_gb"] = totalSizeGB,
                ["used_percentage"] = usedPercentage,
                ["drive_name"] = drive.Name,
                ["drive_format"] = drive.DriveFormat
            };

            if (availableFreeSpaceGB < 5) // Less than 5GB free
            {
                return Task.FromResult(HealthCheckResult.Unhealthy("Disk space critically low", data: data));
            }
            else if (availableFreeSpaceGB < 10) // Less than 10GB free
            {
                return Task.FromResult(HealthCheckResult.Degraded("Disk space low", data: data));
            }
            else if (usedPercentage > 90) // More than 90% used
            {
                return Task.FromResult(HealthCheckResult.Degraded("Disk usage high", data: data));
            }
            else
            {
                return Task.FromResult(HealthCheckResult.Healthy("Disk space adequate", data: data));
            }
        }
        catch (Exception ex)
        {
            _logger.LogError(ex, "Disk space health check failed");
            return Task.FromResult(HealthCheckResult.Unhealthy("Disk space check failed", ex));
        }
    }
}
5. Real-Time Monitoring Dashboards
Custom Monitoring Dashboard
csharp
    // Controllers/MonitoringController.cs
[ApiController]
[Route("api/[controller]")]
public class MonitoringController : ControllerBase
{
    private readonly ITelemetryService _telemetry;
    private readonly IAdvancedLogger _logger;
    private readonly ApplicationDbContext _context;

    public MonitoringController(ITelemetryService telemetry, IAdvancedLogger logger, ApplicationDbContext context)
    {
        _telemetry = telemetry;
        _logger = logger;
        _context = context;
    }

    [HttpGet("metrics")]
    public async Task<ActionResult<ApplicationMetrics>> GetApplicationMetrics()
    {
        try
        {
            var metrics = new ApplicationMetrics
            {
                Timestamp = DateTime.UtcNow,

                // System metrics
                CpuUsage = await GetCpuUsageAsync(),
                MemoryUsage = GetMemoryUsage(),
                DiskUsage = GetDiskUsage(),

                // Application metrics
                ActiveRequests = GetActiveRequestsCount(),
                RequestRate = await GetRequestRateAsync(),
                ErrorRate = await GetErrorRateAsync(),

                // Business metrics
                TotalOrders = await GetTotalOrdersAsync(),
                RevenueToday = await GetRevenueTodayAsync(),
                ActiveUsers = await GetActiveUsersAsync(),

                // Database metrics
                DatabaseConnections = await GetDatabaseConnectionsAsync(),
                SlowQueries = await GetSlowQueriesCountAsync()
            };

            // Track the metrics collection
            _telemetry.TrackMetric("Monitoring_MetricsCollected", 1);

            return Ok(metrics);
        }
        catch (Exception ex)
        {
            _logger.LogError(ex, "Failed to collect application metrics");
            return StatusCode(500, new { error = "Metrics collection failed" });
        }
    }

    [HttpGet("performance")]
    public async Task<ActionResult<PerformanceMetrics>> GetPerformanceMetrics([FromQuery] TimeRange timeRange = TimeRange.LastHour)
    {
        var startTime = GetStartTime(timeRange);

        var metrics = new PerformanceMetrics
        {
            TimeRange = timeRange,
            AverageResponseTime = await GetAverageResponseTimeAsync(startTime),
            P95ResponseTime = await GetPercentileResponseTimeAsync(startTime, 95),
            P99ResponseTime = await GetPercentileResponseTimeAsync(startTime, 99),
            Throughput = await GetThroughputAsync(startTime),
            ErrorPercentage = await GetErrorPercentageAsync(startTime),
            SlowEndpoints = await GetSlowEndpointsAsync(startTime)
        };

        return Ok(metrics);
    }

    [HttpGet("alerts")]
    public async Task<ActionResult<List<Alert>>> GetActiveAlerts()
    {
        var alerts = new List<Alert>
        {
            await CheckErrorRateAlertAsync(),
            await CheckResponseTimeAlertAsync(),
            await CheckDatabasePerformanceAlertAsync(),
            await CheckDiskSpaceAlertAsync(),
            await CheckExternalServiceAlertAsync()
        };

        return Ok(alerts.Where(a => a != null));
    }

    private async Task<Alert> CheckErrorRateAlertAsync()
    {
        var errorRate = await GetErrorRateAsync();
        if (errorRate > 0.05) // 5% error rate threshold
        {
            return new Alert
            {
                Type = AlertType.Error,
                Severity = AlertSeverity.High,
                Title = "High Error Rate Detected",
                Message = $"Current error rate is {errorRate:P2} which exceeds the 5% threshold",
                Timestamp = DateTime.UtcNow,
                MetricName = "ErrorRate",
                MetricValue = errorRate
            };
        }

        return null;
    }

    // Helper methods for metric collection
    private async Task<double> GetCpuUsageAsync()
    {
        // Implementation for getting CPU usage
        return await Task.FromResult(0.15); // Example value
    }

    private double GetMemoryUsage()
    {
        var process = Process.GetCurrentProcess();
        return (double)process.WorkingSet64 / 1024 / 1024; // MB
    }

    private async Task<int> GetTotalOrdersAsync()
    {
        return await _context.Orders.CountAsync();
    }

    private async Task<decimal> GetRevenueTodayAsync()
    {
        var today = DateTime.Today;
        return await _context.Orders
            .Where(o => o.CreatedAt >= today)
            .SumAsync(o => o.TotalAmount);
    }
}

// Models for monitoring
public class ApplicationMetrics
{
    public DateTime Timestamp { get; set; }

    // System metrics
    public double CpuUsage { get; set; }
    public double MemoryUsage { get; set; }
    public double DiskUsage { get; set; }

    // Application metrics
    public int ActiveRequests { get; set; }
    public double RequestRate { get; set; }
    public double ErrorRate { get; set; }

    // Business metrics
    public int TotalOrders { get; set; }
    public decimal RevenueToday { get; set; }
    public int ActiveUsers { get; set; }

    // Database metrics
    public int DatabaseConnections { get; set; }
    public int SlowQueries { get; set; }
}

public class PerformanceMetrics
{
    public TimeRange TimeRange { get; set; }
    public double AverageResponseTime { get; set; }
    public double P95ResponseTime { get; set; }
    public double P99ResponseTime { get; set; }
    public double Throughput { get; set; }
    public double ErrorPercentage { get; set; }
    public List<SlowEndpoint> SlowEndpoints { get; set; }
}

public class Alert
{
    public AlertType Type { get; set; }
    public AlertSeverity Severity { get; set; }
    public string Title { get; set; }
    public string Message { get; set; }
    public DateTime Timestamp { get; set; }
    public string MetricName { get; set; }
    public double MetricValue { get; set; }
}

public enum AlertType
{
    Performance,
    Error,
    Security,
    Business,
    Infrastructure
}

public enum AlertSeverity
{
    Low,
    Medium,
    High,
    Critical
}

public enum TimeRange
{
    Last5Minutes,
    LastHour,
    Last24Hours,
    Last7Days
}
Real-Time Dashboard with SignalR
csharp
Join the conversation! Your thoughts help the community grow.