

When Silverlight was first released with an abundant number of controls,
developers were excited to welcome it with open arms. Soon however, a need was
felt for more greater number and type of controls than offered in the
Silverlight SDK. Some developers went on to use paid third party controls but
there were many who couldn't afford to use those controls or didn't want to use
them as a matter of principle. Keeping these developers in mind, the Silverlight
Toolkit was born. The Silverlight Toolkit is an open source project hosted at
codeplex.com and provides developers a fascinating array of controls that were
unavailable in the SDK. Charting controls are one such group of controls.
Charts enable you to represent data in chart format. You may have used different
types of charts in MS Excel. The Silverlight Toolkit supports creation of pie
charts, line charts, bar charts, and so forth.
The following table lists some of the commonly used chart types in the
Silverlight Toolkit:
| Chart Type | Description |
| AreaSeries | Allows you to create a control that contains a data series to be rendered in X/Y line format. |
| ColumnSeries | Allows you to create a control that contains a data series to be rendered in column format. |
| PieSeries | Allows you to create a control that contains a data series to be rendered in pie format . |
| BarSeries | Allows you to create a control that contains a data series to be rendered in bar format. |
| LineSeries | Allows you to create a control that contains a data series to be rendered in X/Y line format. |
| ScatterSeries | Allows you to create a control that contains a data series to be rendered in X/Y scatter format. |
| BubbleSeries | Allows you to create a control that contains a data series to be rendered in X/Y line format. A third axis binding determines the size of the data point. |
Let's now see an actual example of using some
of these classes. This example assumes that you have Visual Studio 2010,
Silverlight 4 or later, and the latest version of the Silverlight Toolkit.
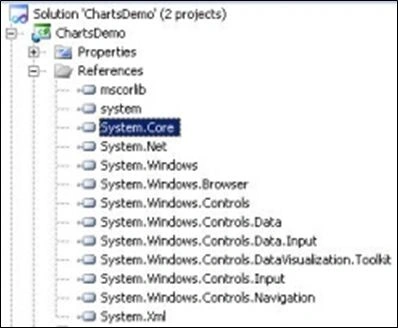
Create a Silverlight application named ChartsDemo and add the following code to
MainPage.xaml.cs:
using
System;
using
System.Collections.Generic;
using
System.Linq;
using System.Net;
using
System.Windows;
using
System.Windows.Controls;
using
System.Windows.Documents;
using
System.Windows.Input;
using
System.Windows.Media;
using
System.Windows.Media.Animation;
using
System.Windows.Shapes;
using
System.Globalization;
using
System.Collections;
namespace
ChartsDemo
{
public partial
class MainPage
: UserControl
{
public MainPage()
{
InitializeComponent();
}
}
// Class to store sales data
public class
SalesInfo
{
public
DateTime SaleDate { get;
set; }
public int
Sales { get; set;
}
}
// Collection of sales data
public class
SalesInfoCollection :
IEnumerable<SalesInfo>
{
public
IEnumerator<SalesInfo> GetEnumerator()
{
yield
return new
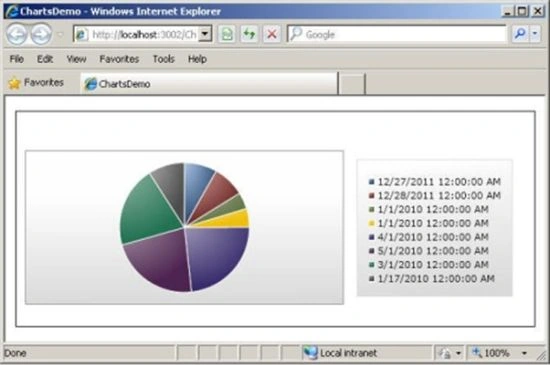
SalesInfo { SaleDate = DateTime.Parse("12/27/2011",
CultureInfo.InvariantCulture), Sales = 2041
};
yield return new SalesInfo { SaleDate = DateTime.Parse("12/28/2011", CultureInfo.InvariantCulture), Sales = 1991 };
yield return new SalesInfo { SaleDate = DateTime.Parse("01/01/2010", CultureInfo.InvariantCulture), Sales = 1033 };
yield return
new SalesInfo
{ SaleDate = DateTime.Parse("01/01/2010",
CultureInfo.InvariantCulture), Sales = 1167
};
yield
return new
SalesInfo { SaleDate = DateTime.Parse("04/01/2010",
CultureInfo.InvariantCulture), Sales = 5815
};
yield
return new
SalesInfo { SaleDate = DateTime.Parse("05/01/2010",
CultureInfo.InvariantCulture), Sales = 5586
};
yield
return new
SalesInfo { SaleDate = DateTime.Parse("03/01/2010",
CultureInfo.InvariantCulture), Sales = 5064
};
yield
return new
SalesInfo { SaleDate = DateTime.Parse("01/17/2010",
CultureInfo.InvariantCulture), Sales = 2268
};
}
Dušan KneževićPosted Oct 21, 2014, 4:23 AM
Thanks, it was useful
enginaarPosted Nov 11, 2013, 1:37 PM
I'm getting the exception "The type 'Chart' was not found." on initialization.
Monika AroraPosted Dec 22, 2011, 1:01 AM
Great what an article. I will surely implement it.
Akash AhlawatPosted Dec 21, 2011, 11:59 PM
Good use of images
Sonakshi SinghPosted Dec 21, 2011, 11:41 PM
Keep writing
Jimmy UnderwoodPosted Dec 21, 2011, 11:33 PM
Very nice work
Alec StewartPosted Dec 21, 2011, 11:33 PM
Its great explanation Mamta, very easy to understand...carry on
Nitin SinghPosted Dec 21, 2011, 11:21 PM
Thanks for sharing
Vineet Kumar SainiPosted Dec 21, 2011, 12:14 PM
Very nice....
Manoj Singh PanwarPosted Dec 21, 2011, 12:03 PM
It was good to work with your codes.. Thank you Mamta
Vikas MishraPosted Dec 21, 2011, 12:00 PM
Hi Mamta you have shared a very Intresting article......
Mike StewardPosted Dec 21, 2011, 11:49 AM
Good work mamta