

Dot net framework
provides strong support for creating graphics with GDI+. Developing graphics
application was never that much easier in past.
You must have
tried to create bar chart on your web site with dirty html or pie chart with
third party components. In this article I am going to demonstrate GDI+
capabilities by creating component which can create a pie chart on fly for your
web pages or for your windows application.
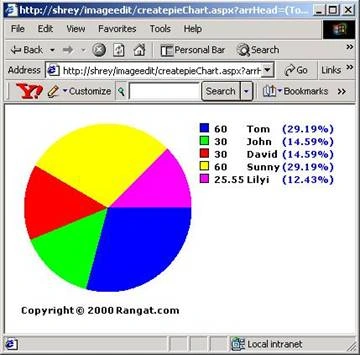
Pie Chart component
is made up of two classes chartData class which encapsulates and creates
various data for creating pie chart and utChart class which contain method which
returns stream object. Both of these classes are under namespace utCharting.
ChartData
Data required for creating chart is array of names and Vals which has to be
distributed through pie. In new method of this class we take inputs as array of
names and values , and using those values we have generated properties which
describe percent values for each elements, similarly we determined span of pie
for each elements by multiplying fraction of each element with 360 ( circle has
360 degree) and we obtained start angle for each elements by adding up span in
loop.
UtChart
This class has one method(getpiechart) which returns stream object which
contains pie chart Image in gif formate, this method require inputs as chartdata
object and integer object for diameter of pie chart.
We used fillpie method of graphics object to generate pie for all elements, most
of the code is for determining size of string to be printed on image and
determining size of image, to be created in memory.
Join the conversation! Your thoughts help the community grow.