

Introduction
In this article, we will use two tables as given below for creating our Pie Chart visualizations. We will first save the tables into an Excel sheet and then we will import the tables using the Power BI Designer. Before proceeding further, let us discuss what Pie Charts are.
"A Pie Chart is a circular chart divided into sectors which display data, information, and statistics in an easy to read 'pie-slice' format with varying slice sizes."
Let us use two tables to plot the Pie Chart.
Table 1
| Task | Hours Spent | Percentage of Total |
| Checking Emails | 0.5 | 6% |
| Returning Calls | 0.75 | 8 |
| Meetings | 1.5 | 18 |
| Wasting Time | 0.5 | 6 |
| Responding to Complaints | 1 | 11 |
| Lunch | 1 | 11 |
| Writing Letters | 0.75 | 8 |
| Break | 0.5 | 6 |
| Planning | 0.5 | 6 |
| Talking to Customers | 2 | 22 |
Table 2
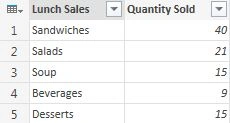
| Lunch Sales | Quantity Sold |
| Sandwiches | 40 |
| Salads | 21 |
| Soup | 15 |
| Beverages | 9 |
| Desserts | 15 |
Let us now create Pie Charts step-by-step.
Step 1: Create tables in Excel
Copy and paste both the tables into the various Excel Sheets and save the Excel sheet.
Step 2: Import Excel table
-
Open Microsoft Power BI Designer and select Excel as a data source from the Get Data dialog box and click on Connect and select the Excel file we just saved from the Open File dialog box.
-
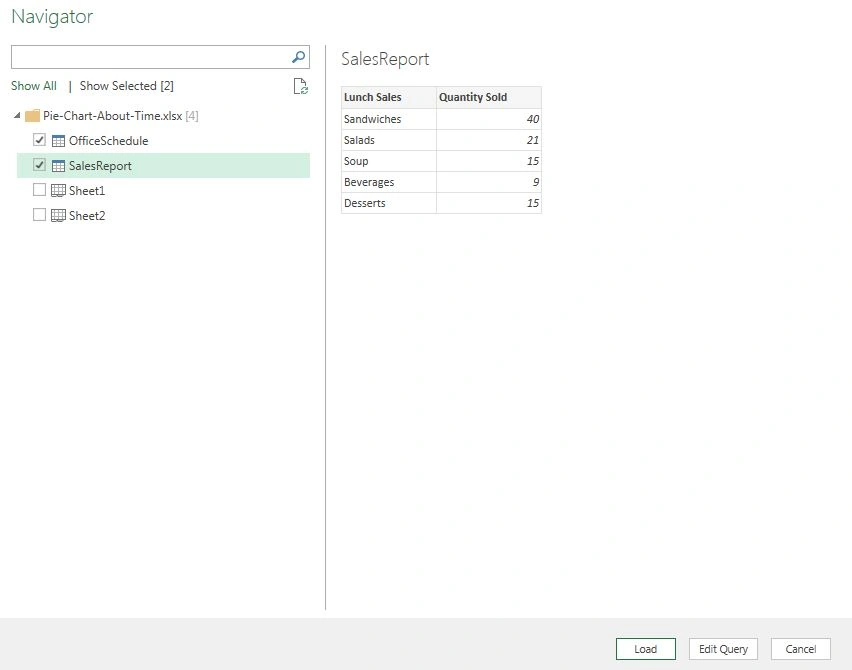
From the Navigator pane, select both the OfficeSchedule and SalesReport table and click on Edit Query.
Step 3: Working with OfficeSchedule Table
Before creating a visualization of the OfficeSchedule table, we need to shape the data of the table.
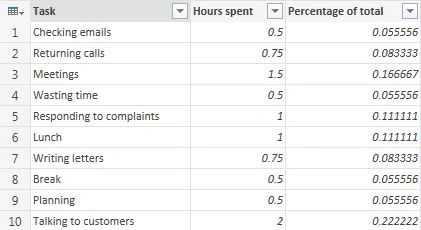
As we can see, the Percentage of the total column has multiple decimal places after the decimal point. Let's round it to up to 2 decimal digits.
-
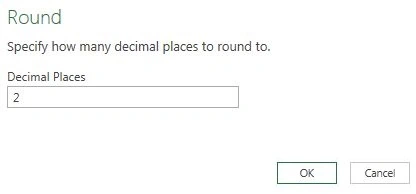
Select the header of the Percentage of the total column and click on the Rounding -> Round option from the transform ribbon tab, it will ask to "Specify how many decimal places to round to". Enter 2 into the TextBox provided and click on OK.
-
Now the decimal places are round to 2 digits. The column Percentage of total tells us what the percentage of Hour spent, so let's multiply this column by 100.
-
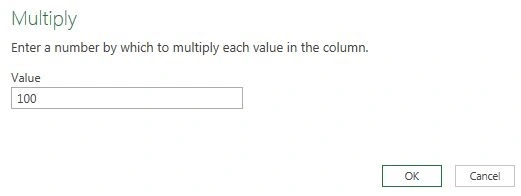
To multiply the column by 100, select the header of the column and click on the Standard -> Multiply option that will ask to "Enter a number by which to multiply each value in the column" and type 100 in the TextBox provided and click on OK.
-
Change the Data Type of the column to Decimal Value.
Now the table is formatted and is ready for creating a visualization.
Step 4: Creating Visualization for OfficeSchedule Table
-
Drag and drop the Task column from the OfficeSchedule table to the report canvas and select Pie Chart as a visualization type.
-
In the Legend section drag and drop the Task column and in the Values section drag and drop the Hours spent column.
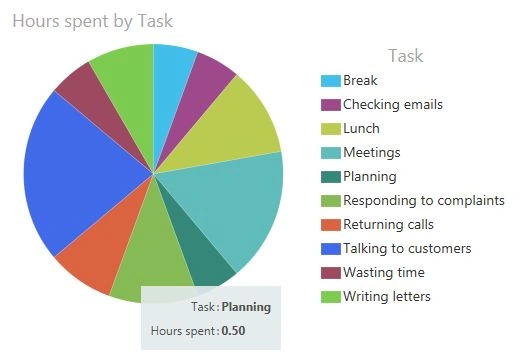
-
Again drag and drop the Task column to the report canvas to create one more Pie Chart and ensure the Task column is in the Legend section and the Percentage of the total column is in the Values section.
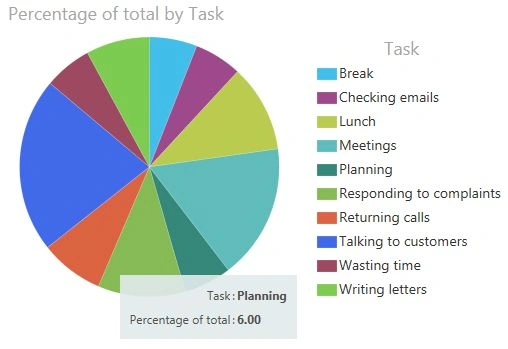
Both of the Pie Charts will look similar to each other, the only difference is, one Pie Chart will display the hours spent and the other will display the percentage out of 100.
Step 5: Working with SalesReport Table
The data in the SalesReport table is already in a shaped manner and is ready for creating a visualization.
Step 6: Creating Visualization for SalesReport Table
-
Switch back to the Report View and add a new page to the report.
-
Drag and drop the Lunch Sales column from the SalesReport table to the report canvas and change the visualization type to Pie Chart.
-
Drag and drop the Lunch Sales column in the Legend section and Quantity Sold column in the Values section.
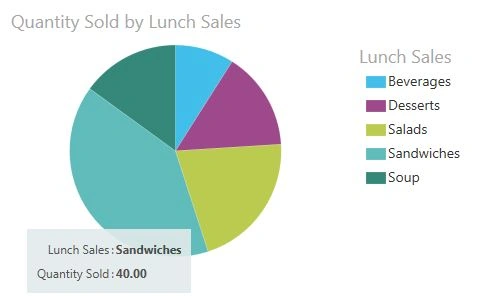
The preceding Pie Chart will show us the quantity of each item sold for lunch.
Summary
In this article, we learned how to create a Pie Chart visualization using Power BI Designer that can be used to easily read and understand the data in an interactive way.
Tom MohanPosted Mar 5, 2015, 10:39 PM
clean article . Nice
Rizwan AliPosted Mar 4, 2015, 11:49 PM
Good one.. here you show the real power of power Bi