

In this article we will use the Chart Web Part to provide a simple way to provide charts on a Web Part page so that users can visualize data in native lists.
First you create a list with the columns Country, Sales Revenue and Sales By Year.
1. In the Quick Launch, you should see that there are two lists that have been created in the site named Sales By Country and Sales By Year. Click on the links to quickly inspect the data inside.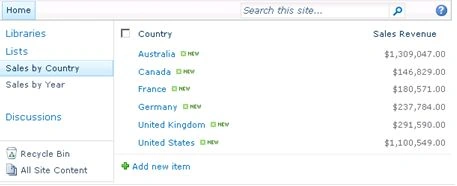
Figure 1: The Sales By Country list
2. The Chart Web Part is part of the Enterprise Edition of SharePoint Server 2010. Therefore, you must activate a specific feature of the Enterprise Edition before you can use the Chart Web Part.
- Select the Site Actions --> Site Settings.
- Inside the Site Collection Administration section of the Site Settings page, select Site collection features.
- Activate the feature titled SharePoint Server Enterprise Site Collection features.
- Navigate back to the Site Settings page using the breadcrumbs.
- Inside the Site Action section of the Site Settings page, select Site features.
- Activate the feature titled SharePoint Server Enterprise Site features.
Note: Activation of these features is what makes the Chart Web Part available.
3. Click on the Home link on the Top Link navigation bar to return to default.aspx.
4. Add an instance of the Chart Web Part to default.aspx using the following steps.
- Select Site Actions --> Edit Page to place default.aspx into edit mode.
- Click on the Add a Web Part button inside the Left Web Part Zone.
- Select the Chart Web Part from the Business Data folder and click the Add button; place it on the page.
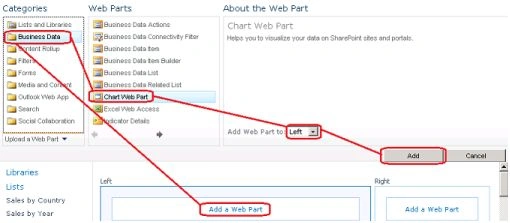
Figure 2: Add the Chart Web part
5. Once the Chart Web Part has been added to the page, you should see a link with the caption Data & Appearance. Click on this link to launch a wizard that will allow you to select a data source.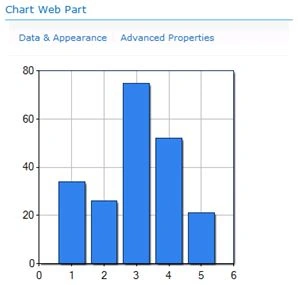
Figure 3: The Chart web part
6. Follow these steps to move through the wizard and connect the Chart Web Part to a SharePoint list as its data source.
- On the first page of the wizard, click the link Connect chart to data.
- Now select a data source. Choose Connect to a List and click next.
- The next page asks you to pick a site and a list. Leave the current site as the selected site and make sure Sales by Country is selected as the target list. Click Next.
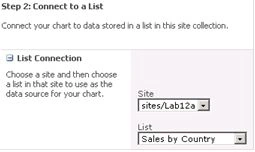
Figure 4: Configure the Chart web part
- The next page shows you the data from the list but requires no action. Click Next.
- The final step of the wizard allows you to bind your chart to the data. Fill out this page as shown in the screenshot below (these should all be default settings on this screen) and click Finish.
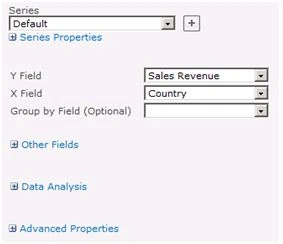
Figure 5: Configure the Chart web part
7. At this point you should have a basic column chart. Now you need to convert it into a pie chart and make it look more polished. Click the Data & Appearance link again and do the following:
- On the first page of the wizard click Customize Your Chart.
- The next page allows you to pick a chart type. Under Chart Type Categories select Pie. Select the 2D Chart Types tab and select the first chart type with the caption of Pie. Click Next.
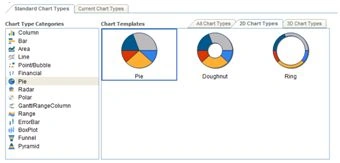
Figure 6: Configure the Chart web part
- The next page allows you to change visual aspects of the chart. Change the Chart Width from 300px to 800px. Change the Chart Height from 300px to 400px. Click Next.
- On the next page, click the checkbox which reads Show Legend. Add a legend title of "Sales By Country".
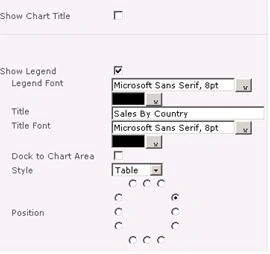
Figure 7: Configure the Chart web part
- Click Finish to complete the wizard and to see the chart which should look like the one shown below.
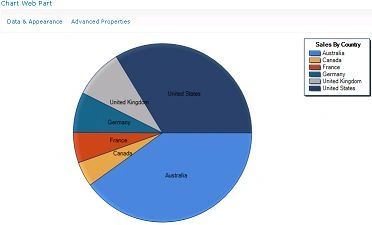
Figure 8: Sales By Country Pie Chart
8. Now you will add a second instance of the Chart Web Part to default.aspx so you can also chart the sales data inside the Sales by Year list.
- Select Site Actions --> Edit Page command to place default.aspx into edit mode.
- In the Left Web Part Zone click on the Add Web Part button.
- Select the Chart Web Part from the Business folder and click the Add button to place it on the page.
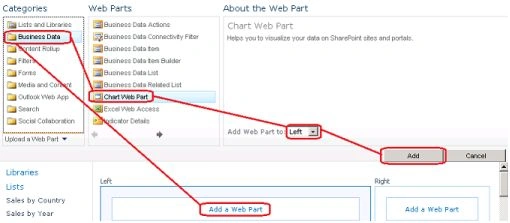
Figure 9: Add another Chart web part
9. At this point the new Chart Web Part instance should appear above the Pie Chart Web Part you created earlier. Now configure this following these directions:
- Click on the Data & Appearance link on the new Chart Web Part instance so you can select a data source.
- On the first page of the wizard, click the link which reads Connect Chart To Data.
- The next page asks you to select a data source. Choose Connect to a List and click Next.
- The next page asks you to pick a site and a list. Leave the current site as the selected site and select Sales by Year as the target list. Click Next.
- The next page shows you the data from the list but requires no action. Click Next.
- The next and final step of the wizard allows you to bind your chart to the data. Fill out this page as the screenshot shown below and click Finish.
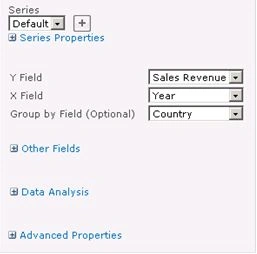
Figure 10: Configure the Chart web part
10. At this point you should have a basic column chart. Now you need to convert it into a line chart and make it look more polished. Click the Data & Appearance link again and follow these steps.
- On the first page of the wizard click Customize Your Chart.
- The next page allows you to pick a chart type. Under Chart Type Categories select Line. Select the 2D Chart Types tab and select the chart type with the caption of Line with no Margin and click Next.
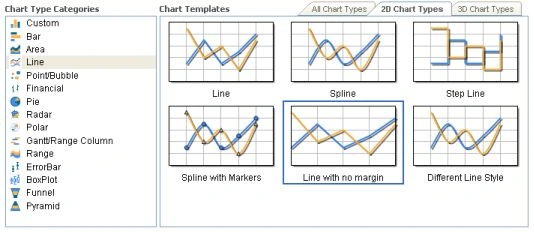
Figure 11: Configure the Chart web part
- The next page allows you to change the visual aspects of the chart. Change the Chart Width from 300px to 800px. Change the Chart Height from 300px to 400px. Click Next.
- On the next page, click the checkbox which reads Show Legend. Add a legend title of "Sales By Country".
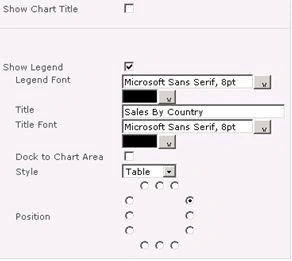
Figure 12: Configure the Chart web part
- Click Finish to complete the wizard and to see the chart which should look like the one shown below.
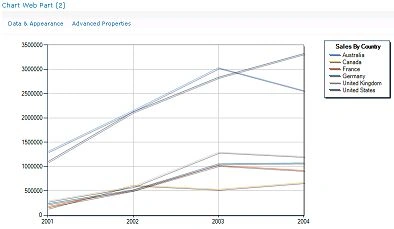
Figure 13: The configured Sales By Country Line Chart web part
Join the conversation! Your thoughts help the community grow.