

The following chart has data from a List with the columns Year (x-axis), Profit This Year (Series1) and ProfitLastYear (Series2):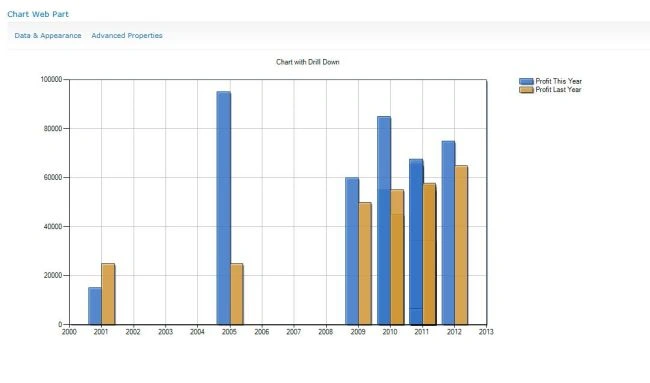
Upon the click of any series of the chart it will redirect to the AllItems page of the list, which will have the list items by which the series has been represented in the graph. We can redirect to any page to show the drill down of the data for the chart.
To do the drill down you need to proceed with the following steps.
Click on the Data & Appearance Hyperlink of the chart webpart as shown below which will redirect to the Data Connection & Chart Appearance Wizards.
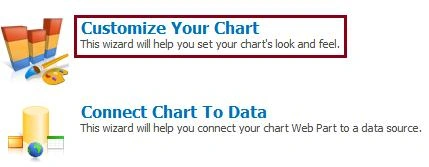
Upon the click of Customize your Chart will redirect to the Chart Customization Wizard.
When the Step-3 Chart element is clicked the properties will expand four options on click of the Hyper links and Tool tip.
It will show a drop down with the series options which are in our chart; on select of the first series we need to mention the series hyper link (Which will cause redirection to the Allitem.aspx on click of the particular series. We can redirect to any page where we want to represent the chart data. For example I have used AllItem.aspx of a list). Which is as shown below: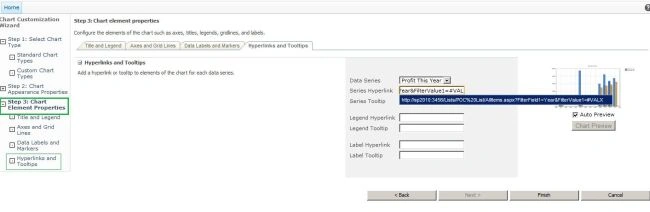
To show the items of a list with which particular a series has been represented in the chart we need to pass the filtername and filter value. In the Hyper link as
(localhost/Lists/List/AllItems.aspx?FilterField1=#AXISLABEL&FilterValue1=#VALX)
| Keyword | Value from Series | Data Value |
| #VALX | X values of the data point | Data Point |
| #VAL, #VALY, #VALY2, #VALY3, ... | Y values of the data point. | Data Point |
| #SERIESNAME | Series name. | Series |
| #LABEL | Data point label. | Data point |
| #AXISLABEL | Axis data point label. | Data point |
The More Keywords can found here.
This is how we can achieve the Drill Down with SharePoint 2010 Chart Web Part.
Hope it will help.
Maryrose BeirnePosted Dec 27, 2012, 12:12 PM
Hi, I don't understand the POC list. The year is not a year. Yet the x axis is a year that shows the profits this year and last year. Should the x axis be different?
Chris LithgoweditedPosted Sep 28, 2012, 9:51 AMEdited Sep 28, 2012, 9:51 AM
You should also take a look at the Nevron Chart web part, it provides much more flexibility and options. Here is a nice topic how to create a drill down chart in SharePoint: http://support.nevron.com/KB/a203/create-interactive-drill-down-chart-in-sharepoint.aspx
karthik reddyPosted Jul 26, 2012, 6:18 AM
Actually where is web part