

Introduction
In this article, we will learn how to create Google charts in Angular 11 in visual studio code.
Step 1
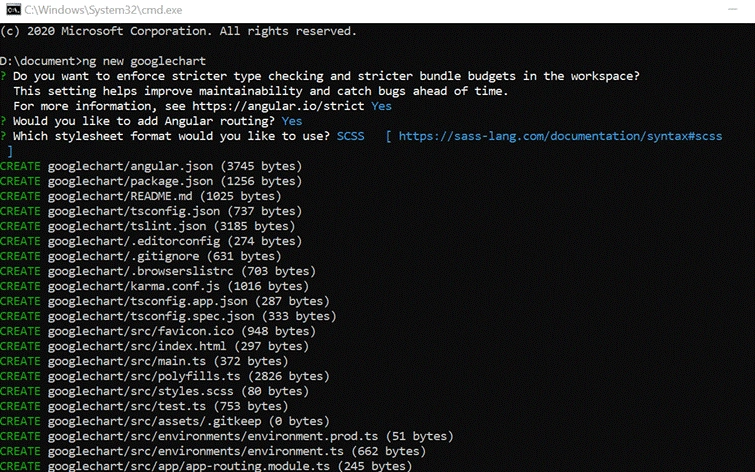
Create an Angular project setup using the below commands or however you create your Angular apps.
ng new googlechart
Step 2 - angular-google-charts
It is an open-source angular based wrapper for Google Charts to provides elegant and feature-rich Google Charts visualizations within an Angular application.
It can be used with Angular components.
Google Charts
It is a pure JavaScript based charting library meant to enhance web applications by adding interactive charting capability.
Supported Chart Types
- Area charts
- Bar charts
- Bubble charts
- Calendar charts
- Column charts
- Pie charts
- Scatter charts
- Histogram charts
- Tree map charts
- Radar charts
- TimeLines charts
- Gauge charts
- Line charts
- WaterFall charts
- Table charts
- Donut charts
Step 3
Open a new terminal and run the following below commands.
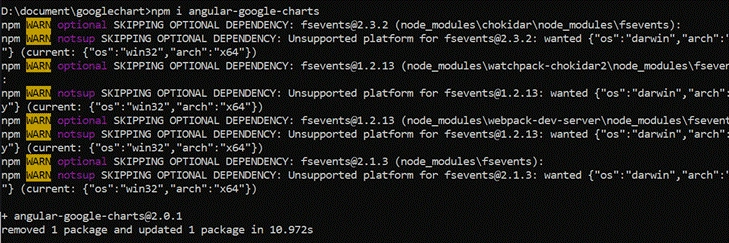
Install Google Charts Wrapper module in Your App.
npm install angular-google-charts
Step 4 - App.module.ts
Now we will declare Google chart in app.module.ts
- import { BrowserModule } from '@angular/platform-browser';
- import { NgModule } from '@angular/core';
- import { AppRoutingModule } from './app-routing.module';
- import { AppComponent } from './app.component';
- import { GoogleChartsModule } from 'angular-google-charts';
- @NgModule({
- declarations: [
- AppComponent
- ],
- imports: [
- BrowserModule,
- AppRoutingModule,
- GoogleChartsModule
- ],
- providers: [],
- bootstrap: [AppComponent]
- })
- export class AppModule { }
Step 5
Now, we will write integration on App.component.html
Shruti SharmaPosted May 18, 2021, 11:35 AM
Hi, would you please can give us the downloadable code, as I am still facing issue in angular 11 version for chart and google chart implementation.