

In this article, I will talk about why data cleaning is required and how to perform that operation like,
- Transform the Data
- Data Formating
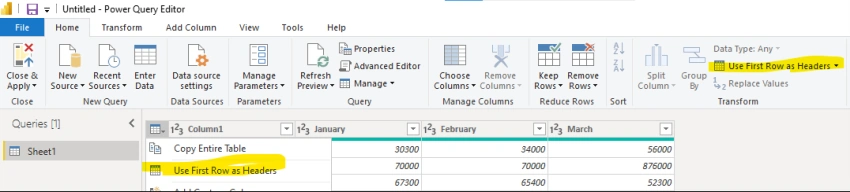
- Set Header as the first row
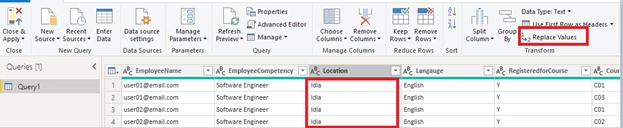
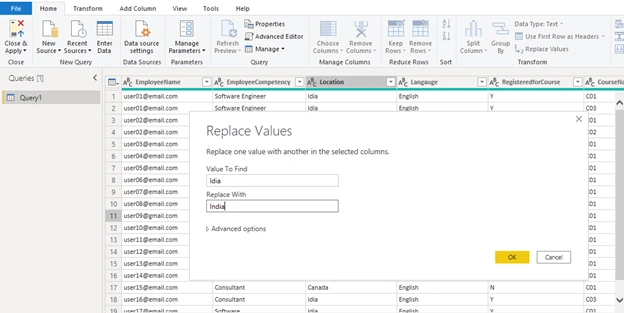
- Replace value (or correction of data)
Let us start with “Why”.
In simple words, whenever the executive needs to present the data, s(h)e needs to start the process of gathering data from multiple sources, followed by an investigation phase. It may have several problems with data such as missing values, duplicates, and incorrect column names. So executives need to clean, transform, and model the data. Every month, the executive follows the same steps for new data. It’s become quite a tremendous tedious task.
“How” to solve the executive problem statement.
Power BI Desktop has an interactive interface with multiple sources of connectors. It helps to create interactive reports locally and the Power BI service is a cloud‑based service used to share content across the folks.
Let us talk about Data Cleaning
When the executive draws the visualization from the data which intervene from multiple sources with the regular growth of data, it is very much required to Clean -> Transform -> Model the data with aggregation and filter of data. Luckily, Power Query has an incredible number of features that are dedicated to helping you clean and prepare your data for analysis. You will learn how to simplify a complicated model, change data types, rename objects, and pivot data. You will also learn how to profile columns so that you know which columns have the valuable data that you are seeking for deeper analytics.
Step 1 - Transform Data (Power Query in Action)
To start shaping your data, open Power Query Editor by selecting the Transform data option on the Home tab of Power BI Desktop as shown in the below image.

In Power Query Editor, the data in your selected query displays in the middle of the screen and, on the left side, the Queries pane lists the available queries (tables).
When you work in Power Query Editor, all steps that you take to shape your data are recorded. Then, each time the query connects to the data source, it automatically applies your steps, so your data has always shaped the way that you specified. Power Query Editor only makes changes to a particular view of your data, so you can feel confident about changes that are being made to your original data source. You can see a list of your steps on the right side of the screen, in the Query Settings pane, along with the query's properties.
The Power Query Editor ribbon contains many actions you can use to select, view, and shape your data.


Join the conversation! Your thoughts help the community grow.