

Introduction
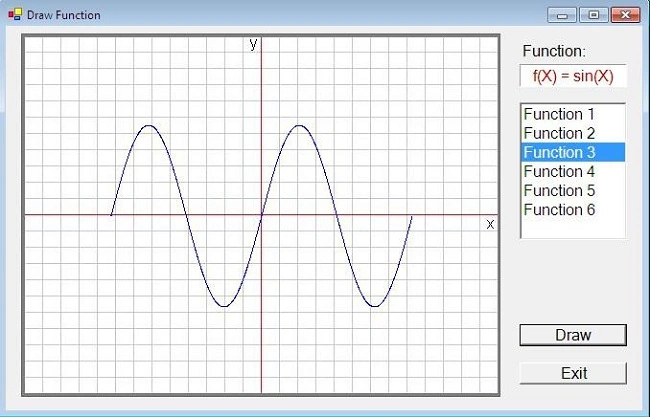
This article explains how to use the SetPixel method to draw some mathematical functions. I created a MathGraph project under C# (2003) to draw the following functions:
- f(X) = x^2
- f(X) = X^3
- f(X) = sin(X)
- f(X) = cos(X)
- f(X) = |X^2- 4|
- f(X) = |sin(X)|
- ListBox control (lstFunction) to select a function.
- Label control (lblFunctionName) to display function definition.
- PictureBox control (PicView) to display function graph, this control has background image from the file (..\..\images\Axis.jpg).
- Button control (btnDraw) to draw the function graph.
- Button control (btnExit) to close the program.
The Code
- // Variables of my program
- private ArrayList PointArray = new ArrayList(); // series of points
- private int PageWidth; // Width of "ImageToDraw" Object
- private int PageHeight; // Height of "ImageToDraw" Object
- private int xCenter; // x coordinate of center
- private int yCenter; // x coordinate of center
- private Bitmap ImageToDraw;
- private double Pi = Math.PI; // 22/7
- //Set the Center coordinates and load ListBox with Functions:
- private void frmGraph_Load(object sender, System.EventArgs e)
- {
- //Width of "ImageToDraw" Object as Width of "PicView" control
- PageWidth = PicView.Width;
- xCenter = (int)PageWidth/2;
- //Height of "ImageToDraw" Object as Height of "PicView" control
- PageHeight = PicView.Height;
- yCenter = (int)PageHeight/2;
- // Fill ListBox
- lstFunction.Items.Add("Function 1");
- lstFunction.Items.Add("Function 2");
- lstFunction.Items.Add("Function 3");
- lstFunction.Items.Add("Function 4");
- lstFunction.Items.Add("Function 5");
- lstFunction.Items.Add("Function 6");
- lstFunction.SelectedIndex = 0;
- }
- // Draw the function: f(X) = X^2
- private void Function1()
- {
- double W = PageWidth/30;
- double H = PageHeight/80;
- // Initiate "ImageToDraw" Object with size same as "PicView" control
- ImageToDraw = new Bitmap(PageWidth, PageHeight);
- // Draw the function f(X) = X^2.
- for (double X = -6 ; X <= 6; X+=0.01)
- {
- double Y = Math.Pow(X, 2);
- // I add xCenter because the point (0,0) is (xCenter, yCenter).
- double PX = xCenter + W*X; // Multiply X*W to enlarge X.
- // I add yCenter because the point (0,0) is (xCenter, yCenter).
- double PY = yCenter - H*Y; // Multiply Y*H to enlarge Y.
- ImageToDraw.SetPixel((int)PX, (int)PY, Color.Blue);
- }
- PicView.Image = ImageToDraw;
- }
In this article we learned how to use the SetPixel methods to draw the curves and you can go to the source file to see the code for drawing the other functions. If you have any idea about this code, please tell me. Thanks for C# Corner team and thanks for all.
Mostafa KaisounPosted Dec 16, 2014, 12:36 PM
Ok my friend, welcome.
Ebrahim MoharramiPosted Dec 16, 2014, 9:41 AM
I said if I had a problem because very comfortable explaining religion and psychology
Mostafa KaisounPosted Dec 16, 2014, 9:21 AM
Sorry, what problem?
Ebrahim MoharramiPosted Dec 15, 2014, 11:02 AM
Hello dear friend had a problem with c # you can use the excellent he ask?
Mostafa KaisounPosted Dec 7, 2014, 2:59 PM
Thank you very much my friend Ebrahim.
Ebrahim MoharramiPosted Dec 7, 2014, 12:18 AM
Hi I use too was very helpful thank you