

Introduction
Managing and organizing data efficiently is an essential part of building applications in Power Apps. One of the most useful functions for this purpose is GroupBy(), which allows developers to organize records into logical groups based on one or more columns. Whether you're building reports, dashboards, or hierarchical galleries, the GroupBy() function helps present data in a more structured and meaningful way.
What is the GroupBy() Function?
The GroupBy() function groups records from a table based on the values in one or more columns. Instead of returning a flat list of records, it creates a new table where each row represents a unique group. Each group contains a nested table with all related records.
Syntax
GroupBy(
    Table,
    ColumnName1,
    GroupColumnName
)
Parameters
Table – The data source or collection to group.
ColumnName1 – The column used to group the records.
GroupColumnName – The name of the new column that stores the grouped records.
Example: Group Employees by Department
Consider the following employee data:
| Employee | Department | Salary |
|---|---|---|
| Emp101 | HR | 50,000 |
| Emp102 | IT | 70,000 |
| Emp103 | HR | 55,000 |
| Emp104 | IT | 75,000 |
| Emp105 | Finance | 60,000 |
To group employees by department, use the following formula:
ClearCollect(
    colGroupedEmployees,
    GroupBy(
        Employees,
        Department,
        EmployeeData
    )
)
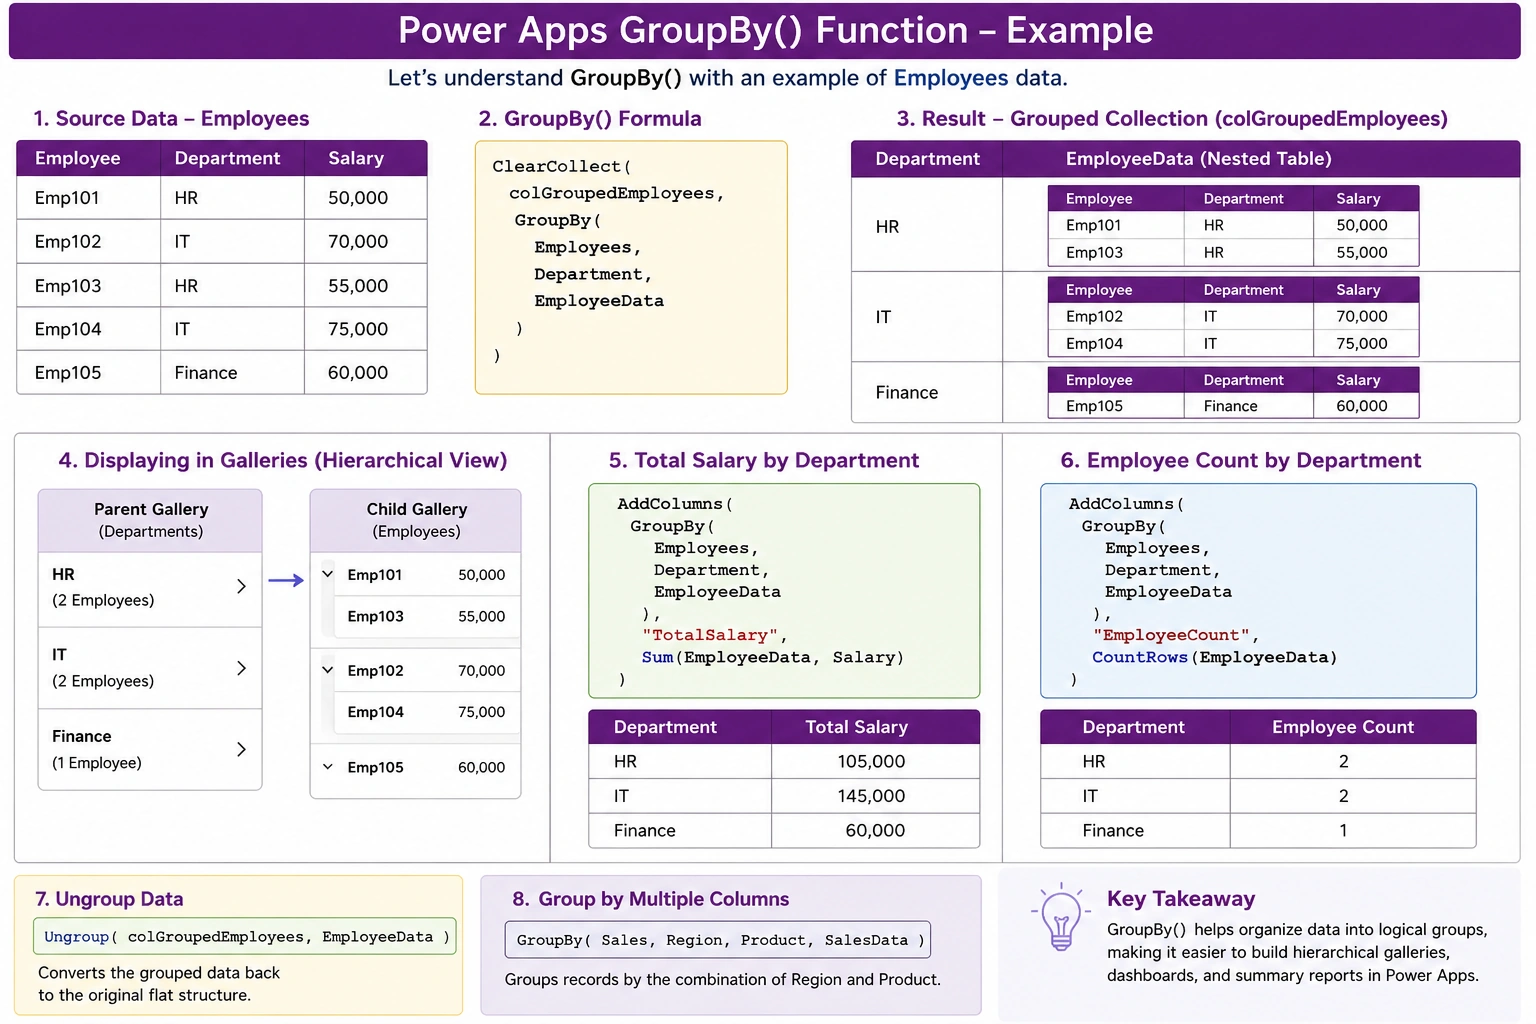
The resulting collection contains one record for each department, while the EmployeeData column stores a nested table containing all employees belonging to that department.
| Department | EmployeeData |
|---|---|
| HR | Emp101,Emp103 |
| IT | Emp102, Emp104 |
| Finance | Emp105 |
Displaying Grouped Data in Galleries
A common use case for GroupBy() is creating hierarchical galleries.
Set the Items property of the parent gallery to:
colGroupedEmployeesDisplay the department name using:
ThisItem.DepartmentInside the parent gallery, insert a nested gallery and set its Items property to:
ThisItem.EmployeeDataThen display the employee name using:
ThisItem.EmployeeThe result is a clean parent-child layout where each department expands to show its employees.
Calculating Total Salary for Each Department
You can combine GroupBy() with AddColumns() and Sum() to create summary reports.
AddColumns(
    GroupBy(
        Employees,
        Department,
        EmployeeData
    ),
    TotalSalary,
    Sum(EmployeeData, Salary)
)
This formula adds a TotalSalary column containing the sum of salaries for each department.
| Department | Total Salary |
|---|---|
| HR | 105,000 |
| IT | 145,000 |
| Finance | 60,000 |
Counting Records in Each Group
To count the number of employees in each department:
AddColumns(
    GroupBy(
        Employees,
        Department,
        EmployeeData
    ),
    EmployeeCount,
    CountRows(EmployeeData)
)
The output provides the total number of employees in every department.
Ungrouping Data
If you need to convert grouped data back into its original flat structure, use the Ungroup() function.
Ungroup(
    colGroupedEmployees,
    EmployeeData
)
This restores the original list of records.
Grouping by Multiple Columns
Power Apps also allows grouping by multiple columns. For example:
GroupBy(
    Sales,
    Region,
    Product,
    SalesData
)
This groups records based on the combination of Region and Product, making it useful for creating more detailed reports and summaries.
Common Use Cases
The GroupBy() function is especially useful in the following scenarios:
Creating expandable or collapsible galleries.
Grouping orders by customer.
Organizing employees by department.
Displaying category-wise reports.
Calculating totals, averages, minimums, maximums, and counts.
Building dashboards with summarized data.
Best Practices
Use meaningful names for the grouped table, such as EmployeeData or SalesRecords, to improve readability.
Combine
GroupBy()with functions likeAddColumns(),Sum(),Average(),CountRows(),Min(), andMax()for powerful data analysis.Be aware of delegation limits when working with large data sources such as SharePoint or SQL Server, as not all grouping operations can be processed server-side.
Test performance when grouping large datasets to ensure a responsive user experience.
Conclusion
The GroupBy() function is one of the most powerful data transformation functions available in Power Apps. It enables developers to organize related records into nested tables, making it easier to build hierarchical galleries, generate summary reports, and perform advanced calculations.
Whether you're building employee directories, sales dashboards, customer reports, or inventory management applications, mastering GroupBy() will help you create cleaner, more efficient, and scalable Power Apps solutions.
Join the conversation! Your thoughts help the community grow.