Background
To represent data on a chart in an application, it is very important to summarize the huge amount of data. Sometimes I wonder when many developers and project managers decided to use third-party chart control for their project but it's not required. The Microsoft .Net Framework is quite a capable and powerful tool to design and create any type of chart control with high quality design. In my career life I have created many custom controls to avoid third-party controls. Because of this I have saved a huge amount of cost that required buying third-party controls for projects. Similarly we can avoid a huge cost by using ASP.Net controls properly instead of third-party controls. So by considering the preceding requirements and to introduce the ASP.Net Chart Control I decided to write this article.
Let us learn about the one ASP.Net chart type Renko and Area chart that provides the powerful UI and design quality. So let us start to learn about these chart type controls step-by-step.
Renko Type Chart
Renko chart is the type of ASP.Net Chart Control that displays a user-interactive graphical information of the data. All the charts are in the System.Web.UI.DataVisualization.Charting namespace.
Chart data is represented on the following points:
- X Axis: the horizontal line of the chart termed as X axis
- Y Axis: the vertical line of the chart termed as Y axis
The Renko Chart type has the following common properties:
- AlternetText: Sets the alternate text when the image is not available.
- Annotation: Stores the chart annotations.
- AntiAliasing: Sets a value that determines whether anti-aliasing is used when text and graphics are drawn.
- BackGradientStyle: Sets the orientation for the background gradient for the chart control. Also determines whether a gradient is used, it has following styles, the default is None.
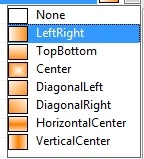
- Backcolor: Sets the background color for the chart, the default color is White
- BackImage: Sets the background image for the chart control.
- BackHatchStyle: Sets the hatching style for the chart control, the default is None. It has the following styles that is used along with the chart as in the following:
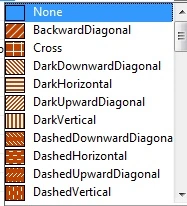
- Height: Sets the height for chart control
- Width: Sets the width for the chart control.
- Palette: Sets the style with a color for the chart control, the default style is Chocolate. The following are the styles available to use:
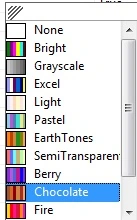
- PaletteCustomColors: Sets the custom color for the chart control, it has the following Color Editor, you can make any custom style for your chart.
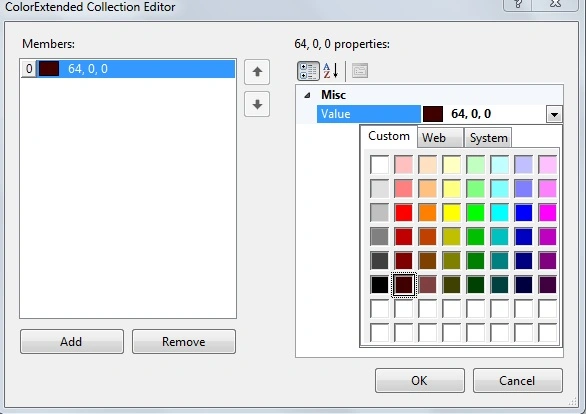
- Series: Sets the series collection for the Chary Control
- Legends: Sets the series of legends to the chart
Now let us see an example of the preceding explanation by creating a simple web application as in the following.
Step 1: Create a table for the chart data
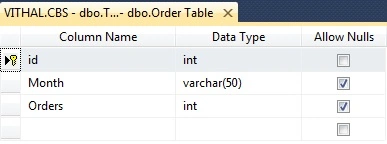
Now before creating the application, let us create a table named orderd in a database from where we show the records in a chart, the table has the following fields (shown in the following image):
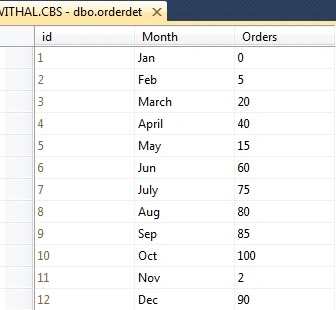
Now insert the some records as listed in the following image into the table:
I hope you have same type of table and records as above.
Step 2: Create Web Application
Now create the project with:
- "Start" - "All Programs" - "Microsoft Visual Studio 2010".
- "File" - "New Project" - "C#" - "Empty Project" (to avoid adding a master page).
- Provide the Project name such as RenkoChart or another as you wish and specify the location.
- Then right-click on Solution Explorer and select "Add New Item" then select Default.aspx page.
- Drag and Drop Chart control from ToolBox onto the Default.aspx page.
Now the Default.aspx source code will be as follows:
- <%@ Page Language="C#" AutoEventWireup="true" CodeFile="Default.aspx.cs" Inherits="_Default" %>
-
- <%@ Register Assembly="System.Web.DataVisualization, Version=4.0.0.0, Culture=neutral, PublicKeyToken=31bf3856ad364e35"
- Namespace="System.Web.UI.DataVisualization.Charting" TagPrefix="asp" %>
- <!DOCTYPE html PUBLIC "-//W3C//DTD XHTML 1.0 Transitional//EN" "http://www.w3.org/TR/xhtml1/DTD/xhtml1-transitional.dtd">
- <html xmlns="http://www.w3.org/1999/xhtml">
- <head runat="server">
- <title>Article by Vithal Wadje</title>
- </head>
- <body bgcolor="blue">
- <form id="form1" runat="server">
- <h4 style="color: White;">
- Article for C#Corner
- </h4>
- <br />
- <asp:Chart ID="Chart1" runat="server" TextAntiAliasingQuality="Normal">
- <Series>
- <asp:Series Name="Series1">
- </asp:Series>
- </Series>
- <ChartAreas>
- <asp:ChartArea Name="ChartArea1">
- </asp:ChartArea>
- </ChartAreas>
- </asp:Chart>
- </form>
- </body>
- </html>
Step 3: Create method to bind the chart control
The Important and complex thing is to bind the chart control properly, because charts exist in a nested series so it's a problem to identify how to set the values.
Now open the default.aspx.cs page and create the following function named Bindchart to bind the Chart Control as in the following:
- private void Bindchart()
- {
- connection();
- query = "select *from orderdet";
- com = new SqlCommand(query, con);
- SqlDataAdapter da = new SqlDataAdapter(query, con);
- DataSet ds = new DataSet();
- da.Fill(ds);
- con.Close();
- DataTable ChartData=ds.Tables[0];
-
- string[] XPointMember = new string[ChartData.Rows.Count];
- int[] YPointMember = new int[ChartData.Rows.Count];
- for (int count = 0; count < ChartData.Rows.Count;count++ )
- {
-
- XPointMember[count] = ChartData.Rows[count]["Month"].ToString();
-
- YPointMember[count] = Convert.ToInt32(ChartData.Rows[count]["Orders"]);
- }
-
- Chart1.Series[0].Points.DataBindXY(XPointMember, YPointMember);
-
- Chart1.Series[0].ChartType = SeriesChartType.Renko;
- }
Now, call the preceding function on page load as in the following:
- protected void Page_Load(object sender, EventArgs e)
- {
- if (!IsPostBack)
- {
- Bindchart();
-
- }
- }
The entire code of the default.aspx.cs page will look as follows:
- using System;
- using System.Collections.Generic;
- using System.Linq;
- using System.Web;
- using System.Web.UI;
- using System.Web.UI.WebControls;
- using System.Data.SqlClient;
- using System.Configuration;
- using System.Data;
- using System.Web.UI.DataVisualization.Charting;
-
- public partial class _Default : System.Web.UI.Page
- {
- private SqlConnection con;
- private SqlCommand com;
- private string constr, query;
- private void connection()
- {
- constr = ConfigurationManager.ConnectionStrings["getconn"].ToString();
- con = new SqlConnection(constr);
- con.Open();
-
- }
- protected void Page_Load(object sender, EventArgs e)
- {
- if (!IsPostBack)
- {
- Bindchart();
-
- }
- }
- private void Bindchart()
- {
- connection();
- query = "select *from orderdet";
- com = new SqlCommand(query, con);
- SqlDataAdapter da = new SqlDataAdapter(query, con);
- DataSet ds = new DataSet();
- da.Fill(ds);
- con.Close();
- DataTable ChartData=ds.Tables[0];
-
-
- string[] XPointMember = new string[ChartData.Rows.Count];
- int[] YPointMember = new int[ChartData.Rows.Count];
-
- for (int count = 0; count < ChartData.Rows.Count;count++ )
- {
-
- XPointMember[count] = ChartData.Rows[count]["Month"].ToString();
-
- YPointMember[count] = Convert.ToInt32(ChartData.Rows[count]["Orders"]);
- }
-
- Chart1.Series[0].Points.DataBindXY(XPointMember, YPointMember);
-
- Chart1.Series[0].ChartType = SeriesChartType.Renko;
-
- }
- }
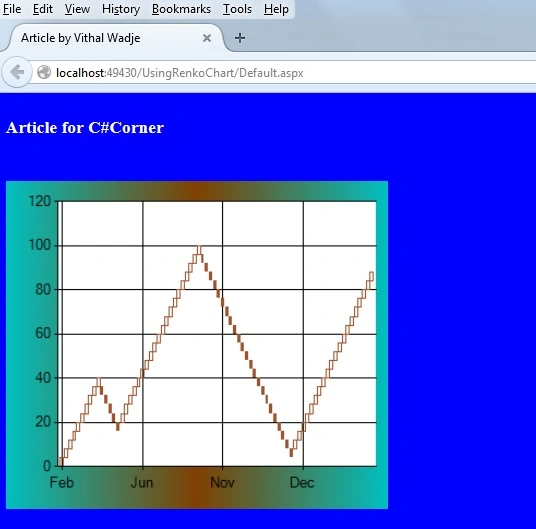
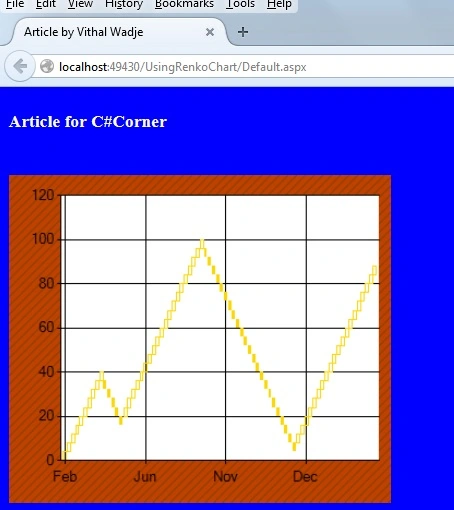
Now, we have the entire logic to bind the chart from the database, let us run the application. The chart will look such as follows:
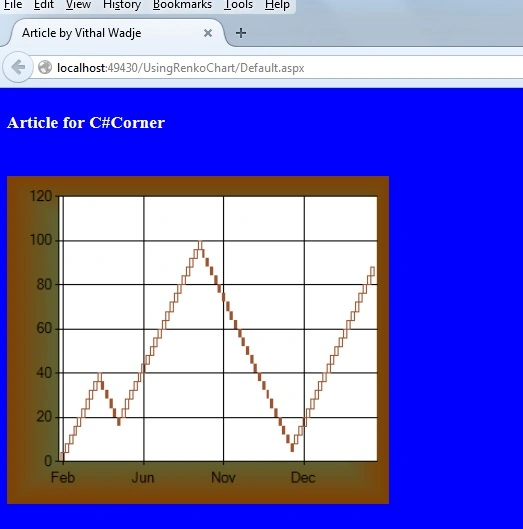
In the preceding chart we saw how the data is properly arranged with user interactive graphics, now let us change the Palette style, the chart will look such as follows:
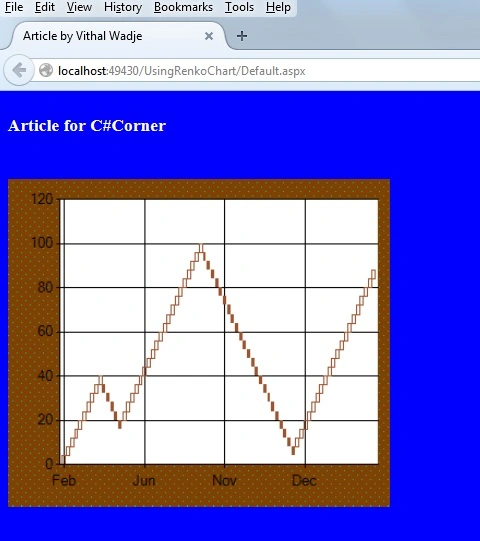
Now let us change the Chart Palette to fire. Then the chart style will be changed as follows:
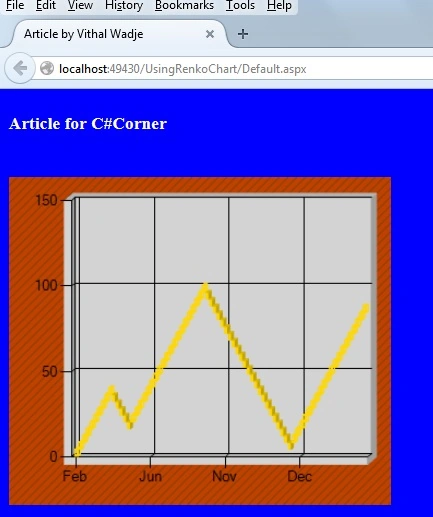
Now let us set the BackHatchStyle, the chart will be visualized as follows:
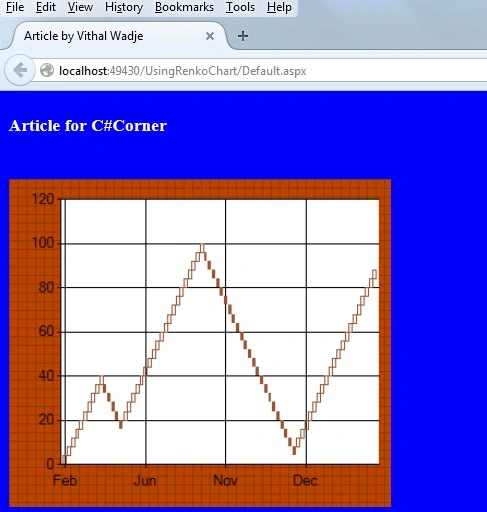
Now change BackHatchStyle to a Cross then the chart will be displayed as follows:
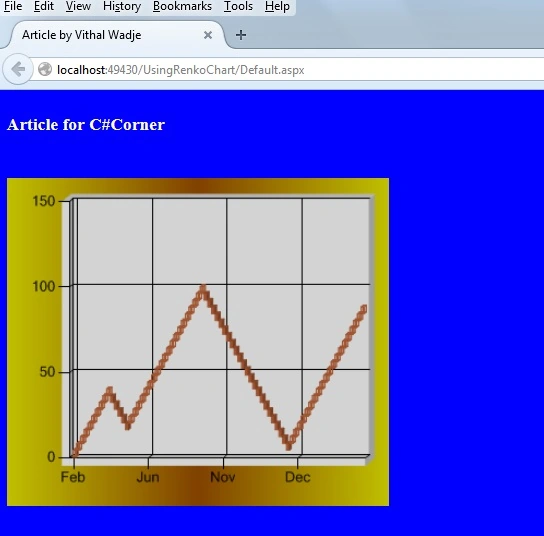
We can also make the chart control in 3D style by setting the property Area3DStyle.Enable3D = true as follows:
The preceding chart is in 3D Style, you can also change the pallet style in 3D as in the following:
Now you have seen how the ASP.Net Chart Control is very capable as compares to third-party controls.
Notes
- Download the Zip file from the attachment for the full source code of the application.
- Change the connection string in the web.config file to specify your server location.
Summary
In my next article I will discuss another chart type of ASP.Net that provides a better user interaction than any other third-party control. I hope this article is useful for all readers, if you have any suggestion then please contact me including beginners also.


Vithal WadjePosted Jan 1, 2016, 1:51 PM
Yes Leopold , Thanks
Leopold MinikusPosted Jan 1, 2016, 10:10 AM
Interesting ... thanks. Just wondering how i can iterate through the bricks? I would like to check for example if two "same direction" bricks in the same direction are existent.
Vithal WadjePosted Dec 31, 2014, 9:48 AM
Thanks Abhishek Arora sir
Abhishek AroraPosted Dec 31, 2014, 7:35 AM
Vithal Wadje sir good to see your article selected as article of the day on the Microsoft ASP.NET community.
Vithal WadjePosted Dec 31, 2014, 2:11 AM
Thanks Sandeep Singh Shekhawat sir
Vithal WadjePosted Dec 31, 2014, 2:10 AM
Thanks Dinesh Beniwal sir for your great support and motivation ,only because of your support we get courage to write articles
Sandeep Singh ShekhawatPosted Dec 31, 2014, 1:44 AM
Congratulations Vithal. Its selected aas Articles of the Day on Microsoft ASP.NET community.
Dinesh BeniwalPosted Dec 31, 2014, 1:24 AM
Congratulations Vithal Wadje Articles of the Day on ASP.NET
Vithal WadjePosted Dec 16, 2014, 12:59 AM
Thanks Michal Habalcik sir
Michal HabalcikPosted Dec 16, 2014, 12:57 AM
never heard about Renko before, thanks for introducing it ...
Vithal WadjePosted Dec 15, 2014, 11:48 PM
thanks Manish Kumar Choudhary sir
Manish Kumar ChoudharyPosted Dec 15, 2014, 11:33 PM
nice one..