

Before reading this article, I highly recommend reading my previous parts:
- Site Templates Part 1: Team Site in SharePoint 2013 and Office 365
- Site Templates Part 2: Blogs in SharePoint 2013 or Office 365
- Site Templates Part 3: Project Site in SharePoint 2013 and Office 365
- Site Templates Part 4: Community Site in SharePoint 2013 and Office 365
- Site Templates Part 5: Document Center in SharePoint 2013 and Office 365
- Site Templates Part 6: Records Center in SharePoint 2013 and Office 365
Welcome to the 7th Site template, Business Intelligence Center in SharePoint 2013/Office 365. This will be the parts of my article Site Templates in SharePoint 2013/Office 365. Here we will see what the components available are. We will see what the Business Intelligence Center template provides us.
Click on create a new site, the following form opens up.
- Title and Description:
- Web Site Address: Here you can make it different from your default site name.
- Template Selection: Here you have an option to select the language and to choose a site from a template having many options.
Here in this article we will be seeing the Business Intelligence Center template under the Enterprise group so select it.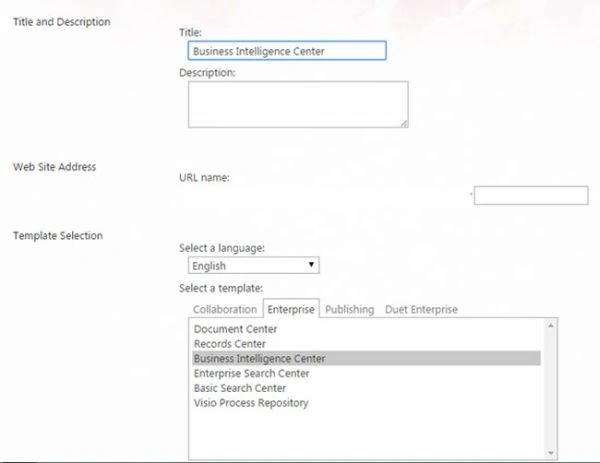
- Permissions: Here you can assign permission to the site directly, either by inheriting the permissions from the parent or assigning it unique permissions.
- Navigation Inheritance: Using this option you can inherit the same navigation as your parent site.
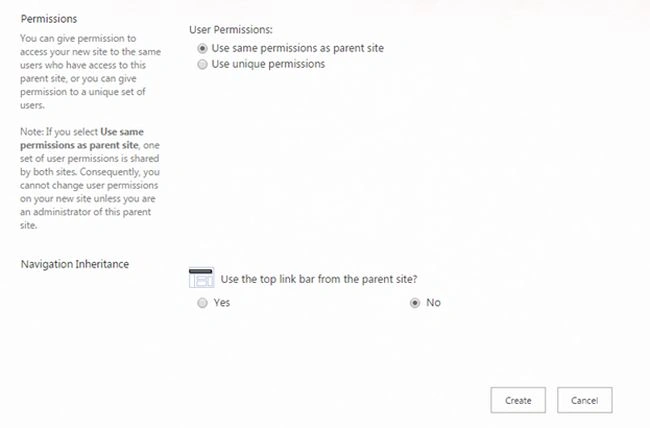
- Click on Create, it will create the site.
Let's see what it has for us.
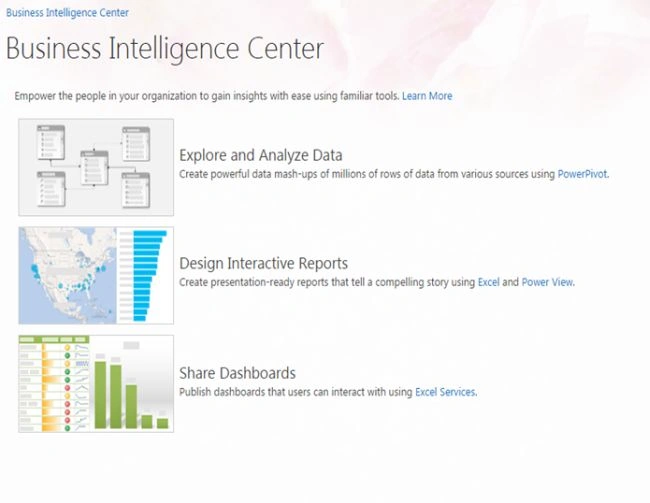
Business Intelligence Center is a portal that contains the tools of all the services we can use to connect Power Pivot, Excel and Power services.
This will help an organization to connect using various services.
The Home page has been divided into three categories, Explore and Analyze Data, Design Interactive Reports and Share Dashboards.
- Explore and Analyze Data
Here we can create data rows using the Power Pivot tool. Once you click on the link it will take you to the Power Pivot help center as in the following screen and to the link below.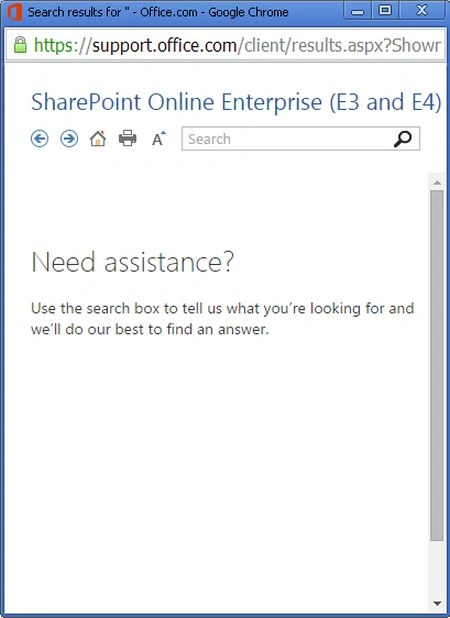
Link: SharePoint Online Enterprise (E3 and E4) Help.
- Design Interactive Reports:
Here you can create presentations in the form of reports and place it on the view using Excel and Power tools. Once you click on the link it will take you to the Excel and Power help center as in the following screen and to the link below.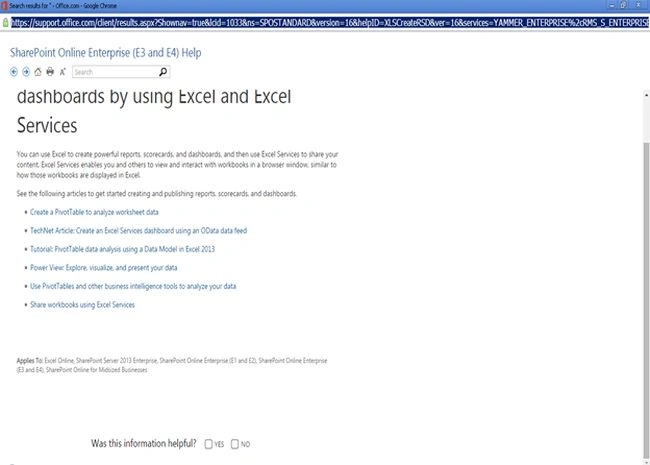
Link: Create and share reports, scorecards and dashboards by using Excel and Excel Services.
3. Share Dashboards:
Here we can share a dashboard where the users can connect to Excel services. Once you click on the link it will take you to the Excel services as in the following screen and to the link below.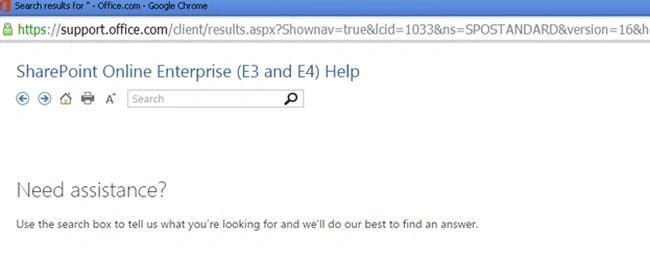
Link: Need assistance?
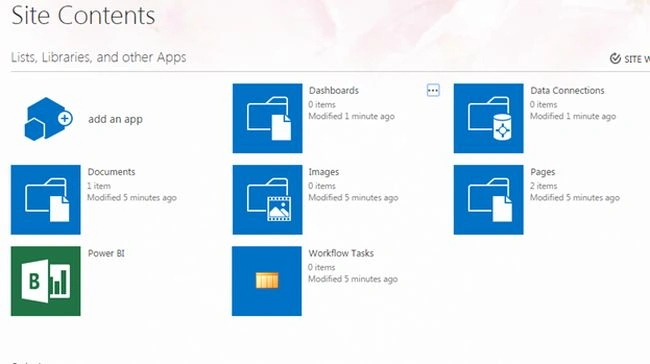
Here we have contents as:
- Dashboards: It contains all the dashboards you want to add your views to.
- Data Connections: It contains all the data connections files in the site.
- Documents: It contains all the document files in a library.
- Images: It contains all the image files in a library.
- Power BI: Microsoft provides comprehensive BI tools that integrate across Office applications and other Microsoft technologies. These tools enable analysis, reporting, dashboards and visualizations.
- Workflow Tasks: It stores all the tasks of the site.
- Pages: It stores all the pages of the site.
Data Connections
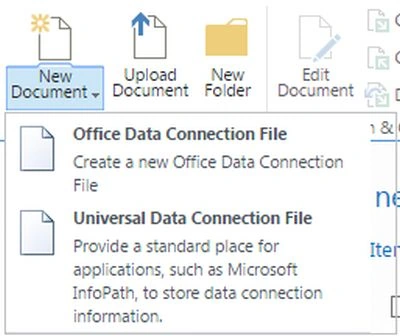
Now when you see the data connections library, you have the option to upload to various kinds of data connections.
- Office Data Connection File: A general connection file.
- Universal Data Connection File: A connection file to Microsoft InfoPath and a place to store the values of the Data Connection File.
Dashboards
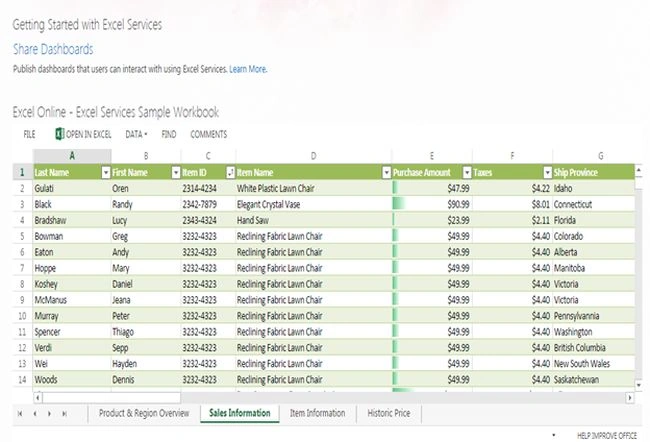
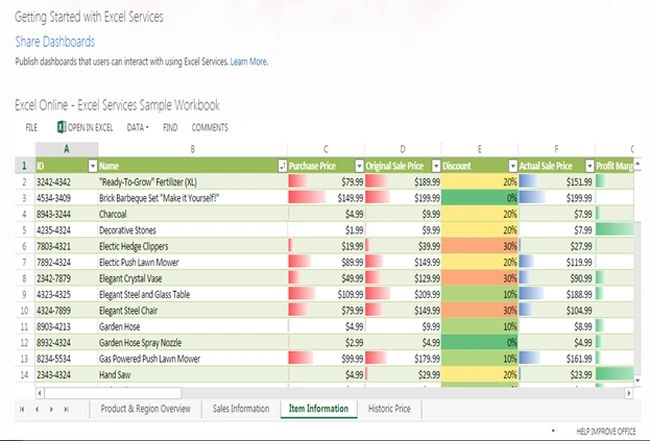
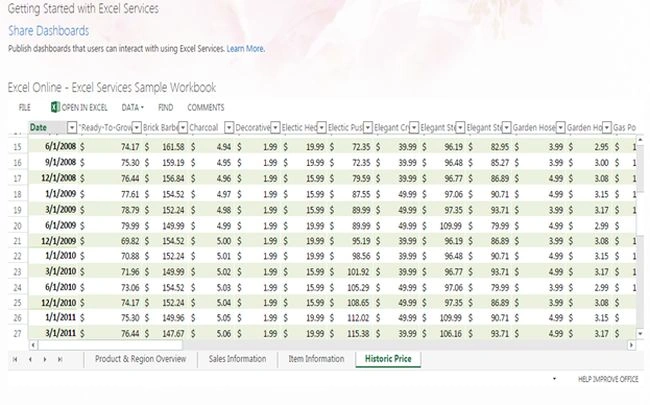
The following are the examples of the dashboards we can get them connected to Excel, pivot and presentation services.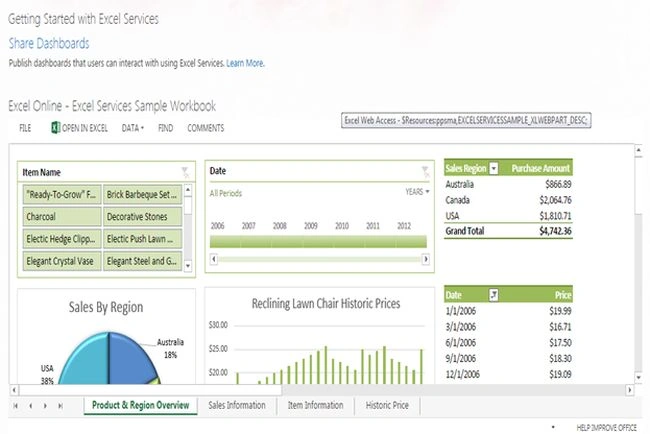
Site Settings
Finally we can see the site settings, that you can see from the previous blogs an C# Corner. Link: Site Settings in SharePoint 2013.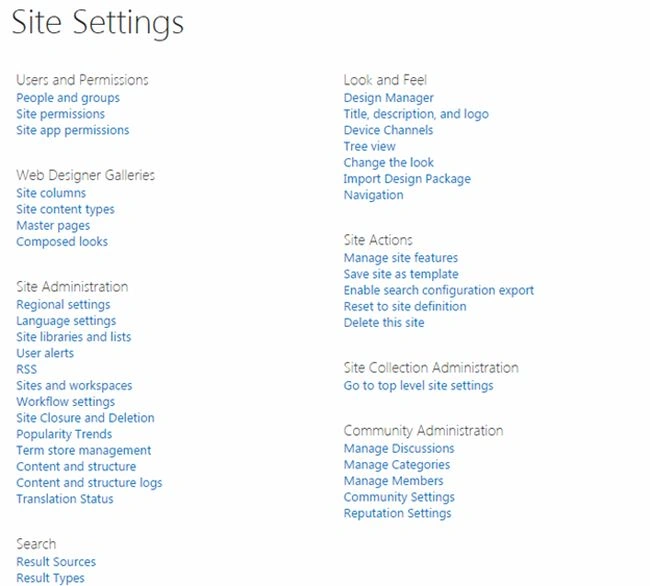
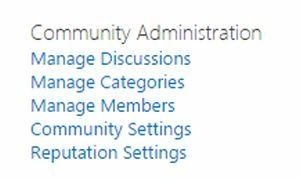
Here it was a new user friendly and a wonderful portal for the users using Business Intelligence Center.
Keep Learning!!
Cheers.
Sr KarthigaPosted Apr 19, 2016, 10:17 PM
good one
Sr KarthigaPosted Apr 19, 2016, 10:17 PM
Nice explanation
Gowtham RajamanickamPosted Apr 8, 2016, 9:20 AM
good one...
Kumaresh RajalingamPosted Feb 20, 2016, 4:44 AM
Nice explanation