

Introduction:
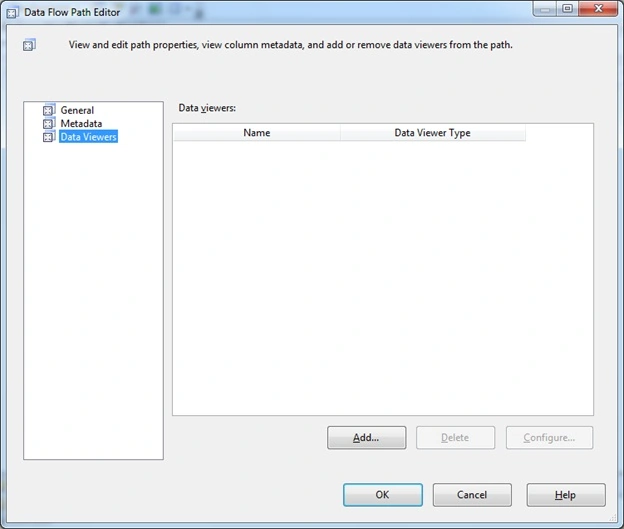
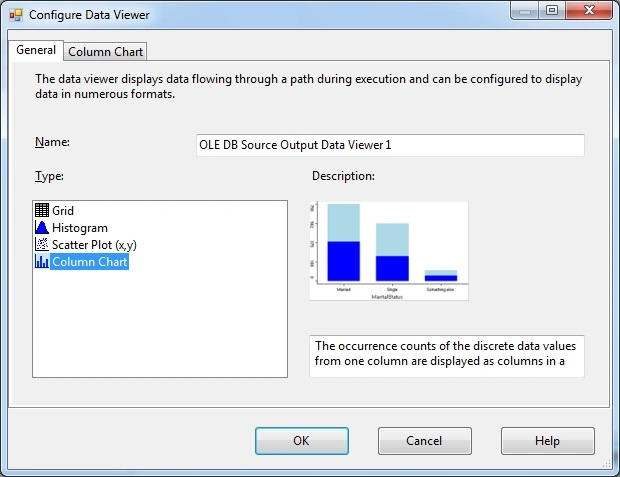
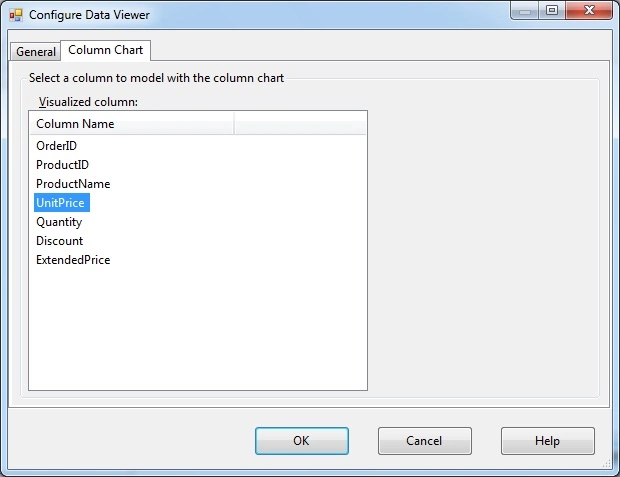
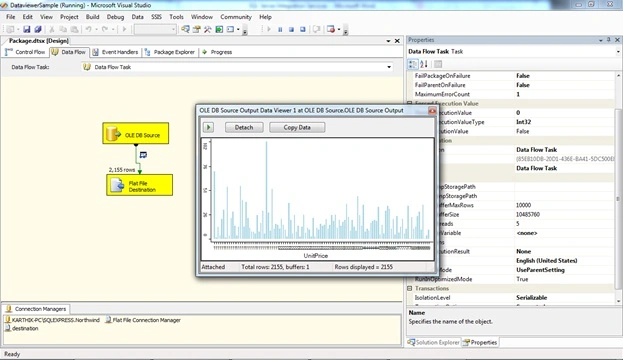
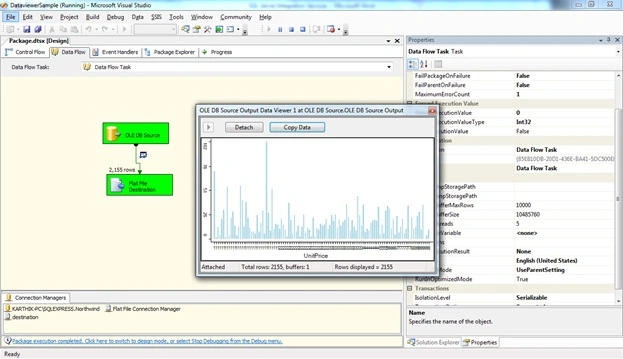
In this article we are going to see how to use the Data viewers (Column Chart) in SSIS packaging. Data viewers are used as one of the debugging options for developers to check the data between the processes of a package. Data viewers are good in places where we have a minimum of data to analyze and then executing the package at the development stage to see the changed took place in the prior task and proceed to the next task. Let's jump start to see this sample of how to set the properties of the control.
You can look into my series of articles on SSIS at the url - http://f5debug.net/all-articles/
Steps:
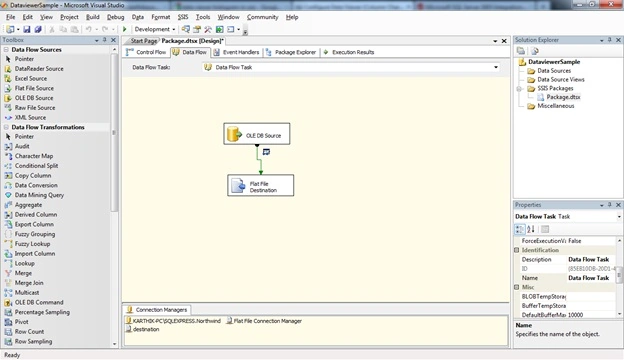
Follow steps 1 to 3 on my first article to open the BIDS project and select the right project to work on an integration services project. Once the project is created, we will see how to use the data viewers to see the data flow. Now once the project is opened, drag and drop a source and a destination task along with a dataflow to do some manipulation as shown below:
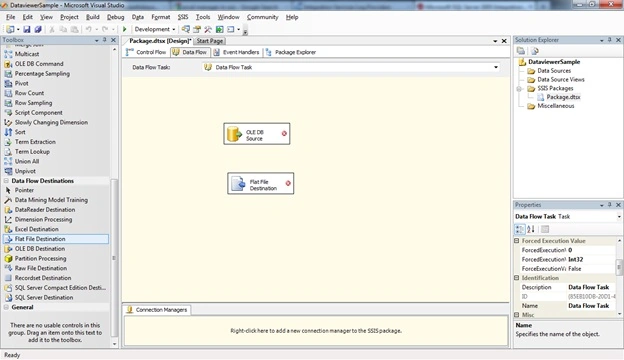
Now we will do the small task of copying the data from the source table to a destination file using the OLEDB source and FlatFile destination as shown above.
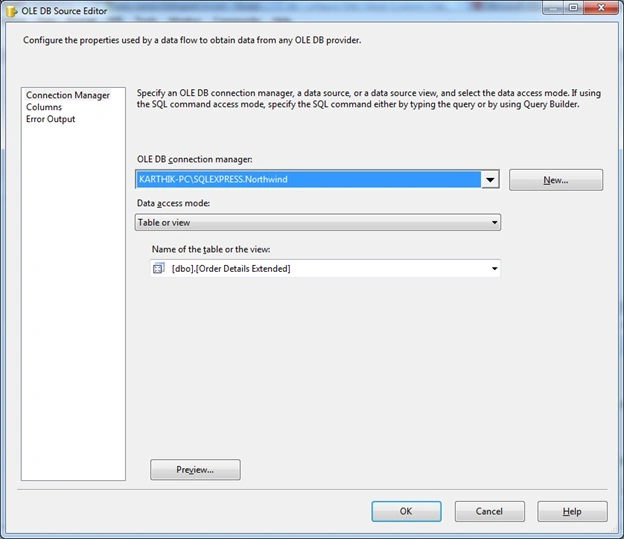
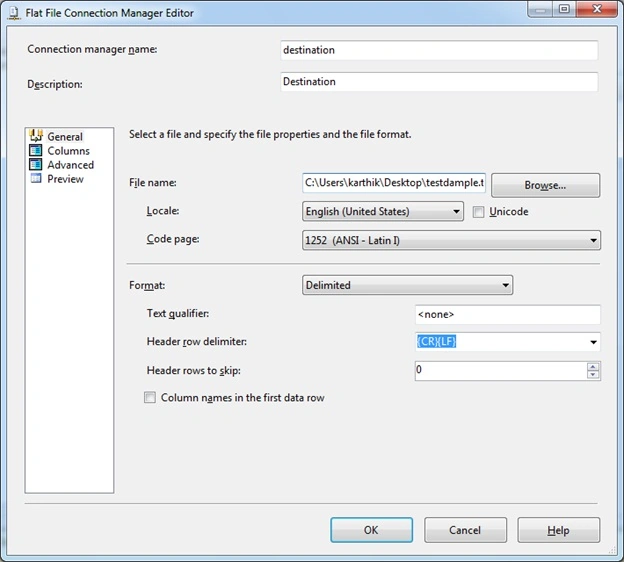
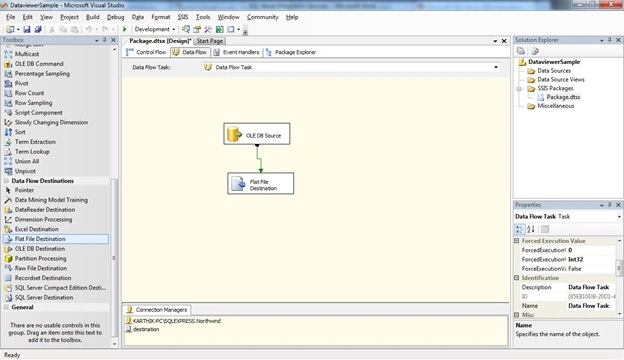
Now let's configure both the tasks to make a flow as shown below.
Source Configuration:
Join the conversation! Your thoughts help the community grow.