

Note: this article is published on 08/08/2024.
This series of articles will discuss SQL Server Reporting Services, including the related Services:
- SSRS (1) --- Server Setup: SSIS, SSAS, and SSRS
- SSRS (2) --- Client Setup: SSDT and Report Builder
- SSRS (3) --- Report Build and Deploy as a VS Project --- this article
- SSRS (4) --- SQL Server Database Project in Visual Studio
A - Introduction
The services discussed include:
- SSIS --- SQL Server Integration Services
- SSAS --- SQL Server Analysis Services
- SSRS --- SQL Server Reporting Services
- SSDT --- SQL Server Data Tools
The first article of this series discussesed the Server side Instalation and Configuration. The second discussed the Client side (the Development Invironment) Installation and Configuration, inluding Visual Studio setup by installing Extentions and a Desktop app Report Builder. This article will make a sample of Report from Visual Studio Environment by using both the pre-setup SSIS, SSAS, Server and the SQL Server DAta Tools
This will be the content of this article:
- A - Introduction
- B - Create a report server project
- C - Create a report definition file (RDL)
- D - Set up a connection
- E - Define a Transact-SQL query for report data
- Add a table data region and fields to a report layout
- Preview your report
- F - Formating
- Date
- Currency
- Change text style and column widths
- G - Group data in a report
- H - Add totals to a report
- line Total
- Daily Total
- Grand Total
- Preview the report
- I - Add a Report Parameter
- J - Publish the report to the Report Server
- K - Export to Excel
B - Create a report server project
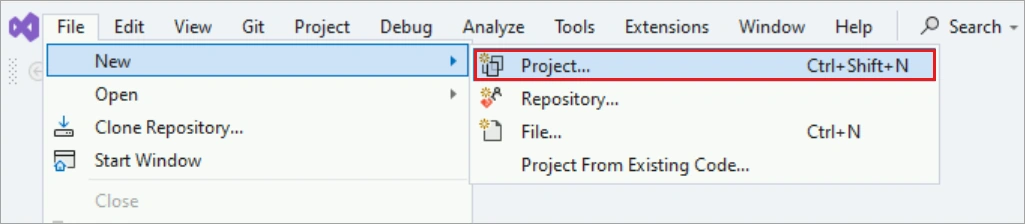
- In Visual Studio (VS), Right Click File > select New > Project from the File menu.
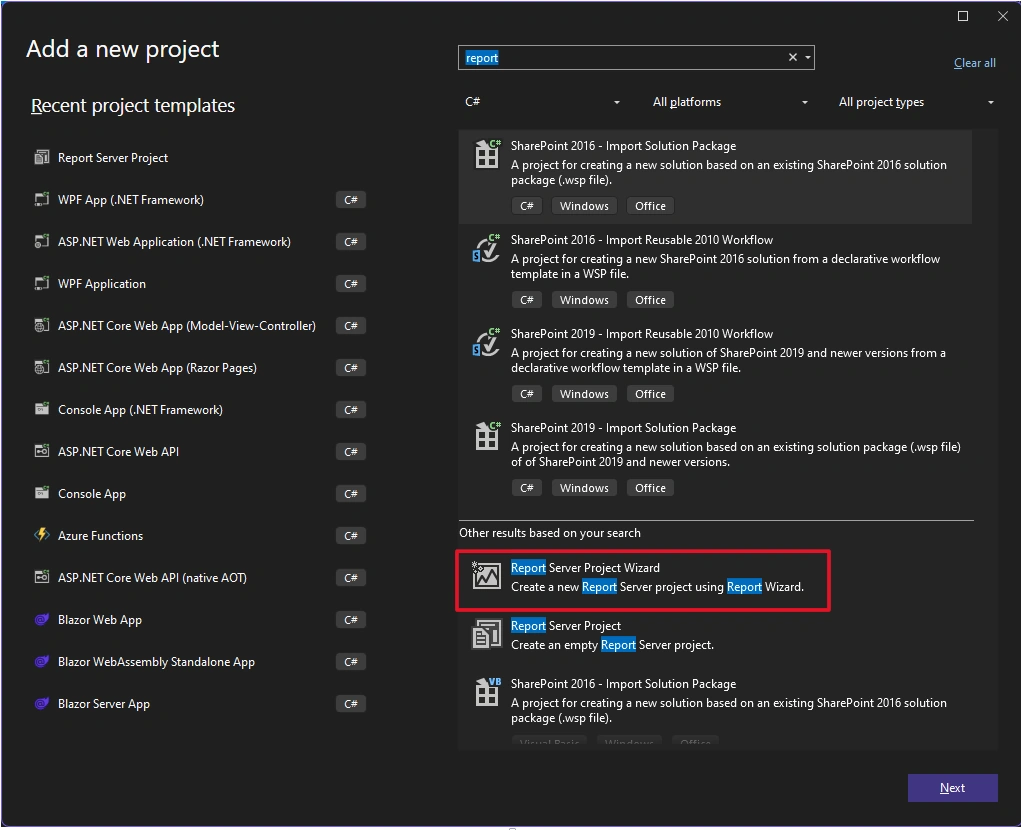
- In the Create a New Projuct page, search for "Report Server Project", and select Report Server Project, and then choose Next
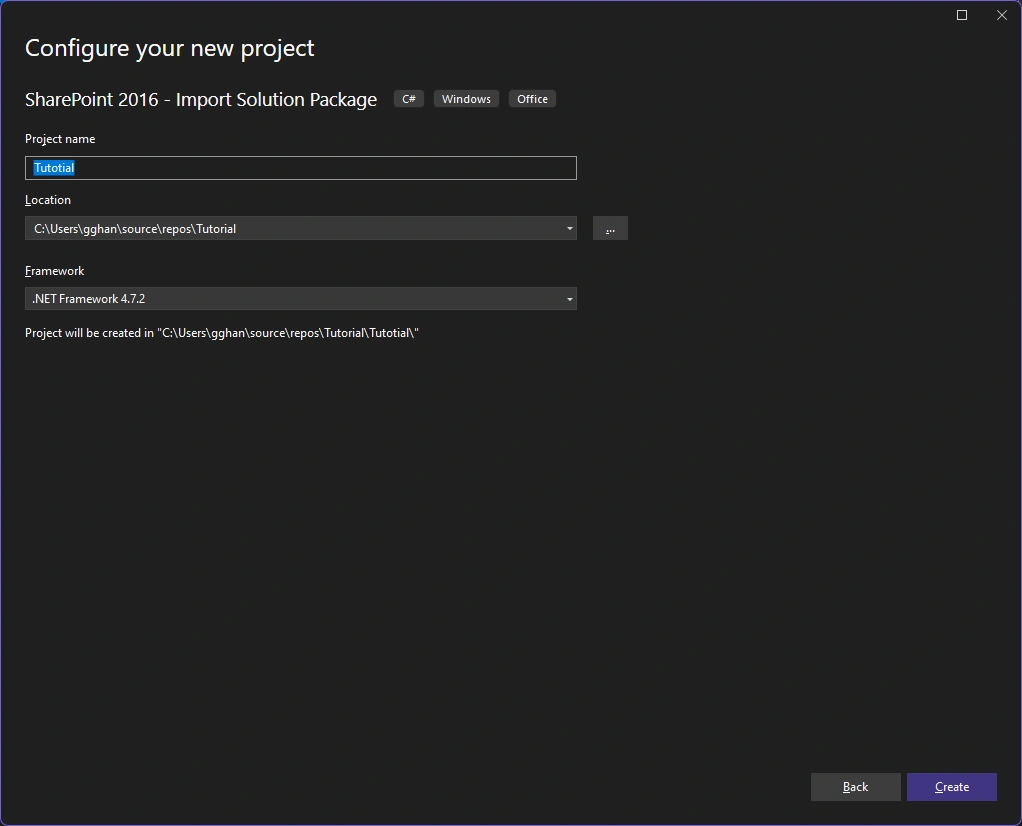
- In the Project name box, enter "Tutorial" for the project name > Create
C - Create a report definition file (RDL)
Next, you create a report definition file (RDL). This process involves setting up the report within the project you created.
-
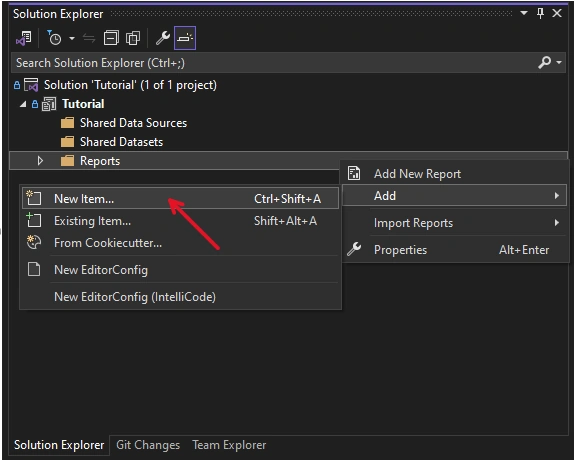
In the Solution Explorer pane, right-click the Reports folder. Select Add > New Item.
-
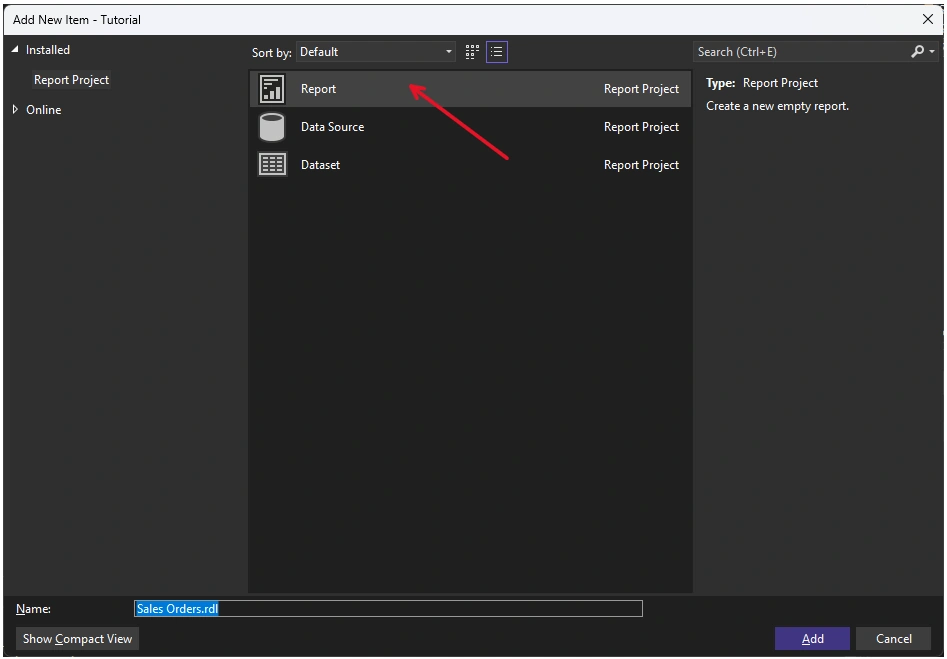
In the Add New Item window, select Report > Enter "Sales Orders.rdl" into the Name box > Add
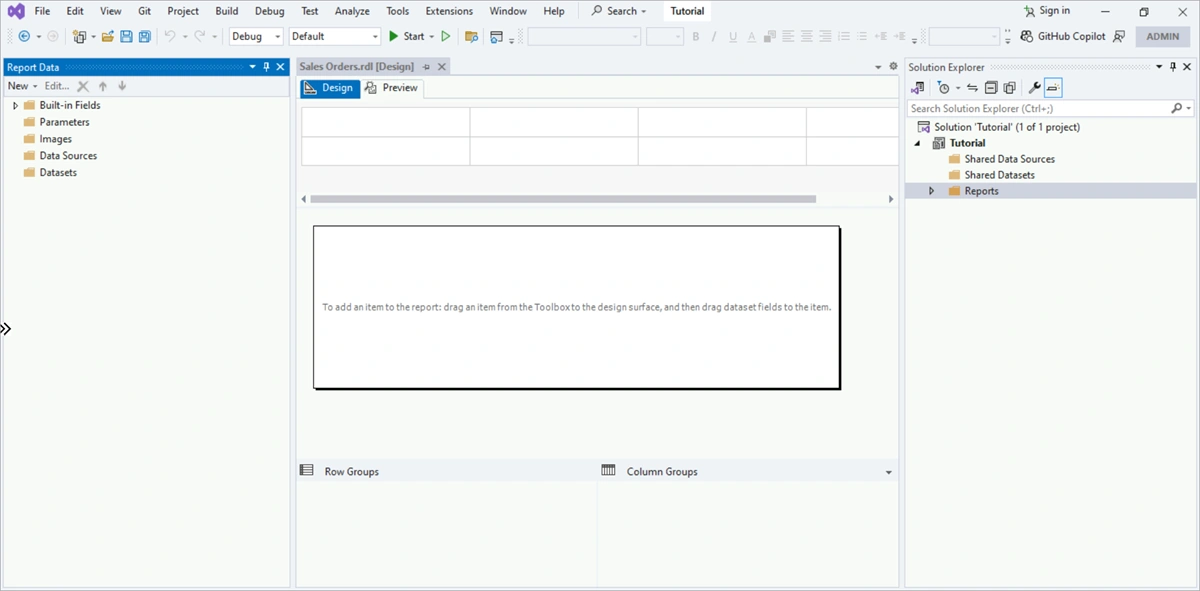
- Report Designer opens and displays the Sales Orders report file in Design view.
D - Set up a connection
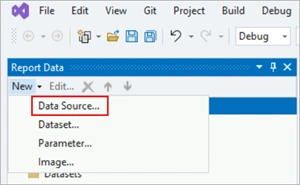
- In the Report Data pane, select New > Data Source.
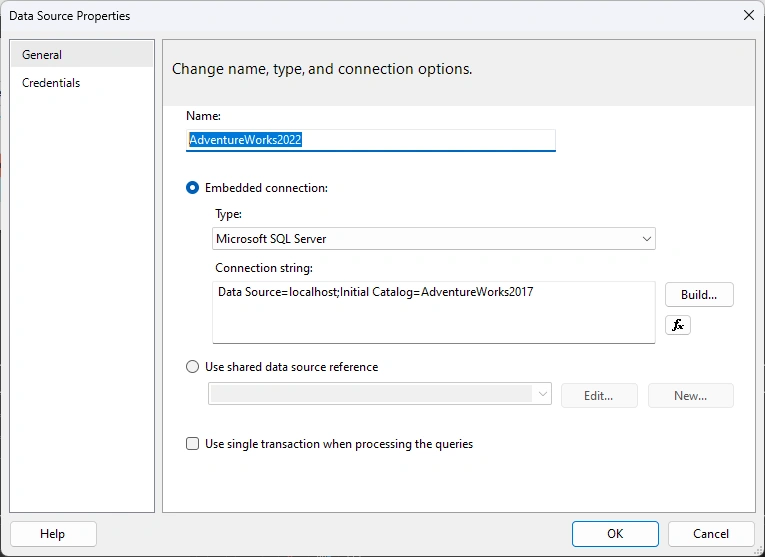
- The Data Source Properties dialog opens with the General section selected > Select Embedded connection > Click Build
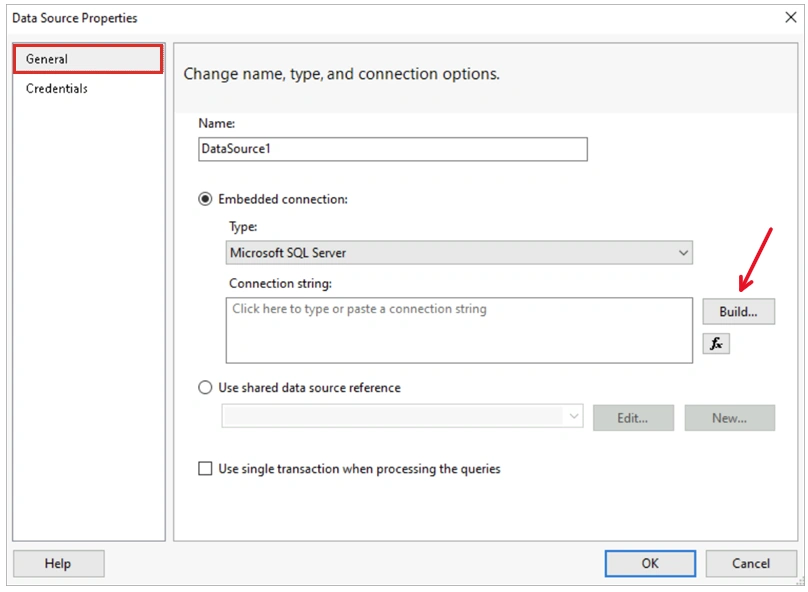
- Setup the connection

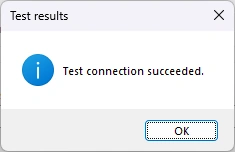
- Test the Connection > OK
- Back to Data Source Properties > named as AdventureWork3033
-
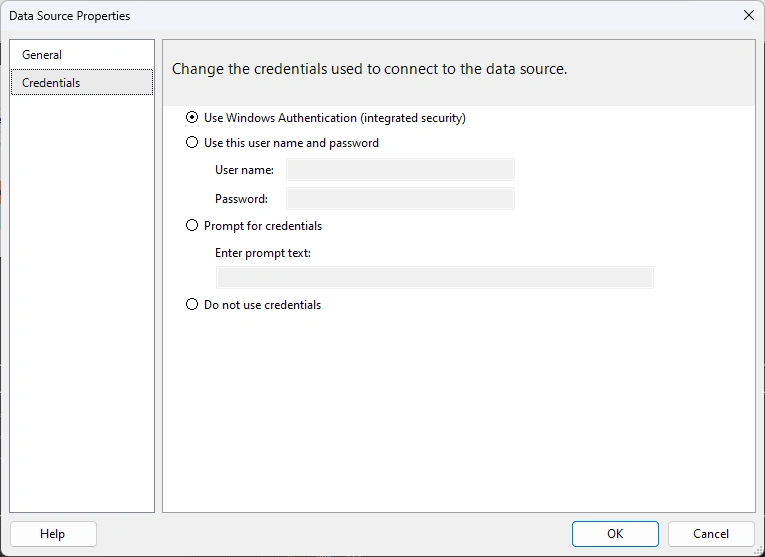
Select Credentials. Choose the Use Windows Authentication (integrated security) option.
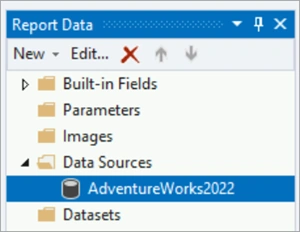
- Select OK. Report Designer adds the AdventureWorks2022 data source to the Report Data pane.
E - Define a Transact-SQL query for report data
- In the Report Data pane, select New > Dataset or Right Click DataSet > Add DataSet,
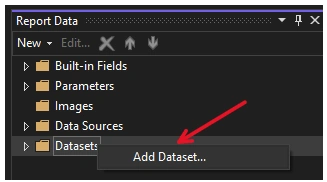
then the Dataset Properties dialog opens with the Query section highlighted.
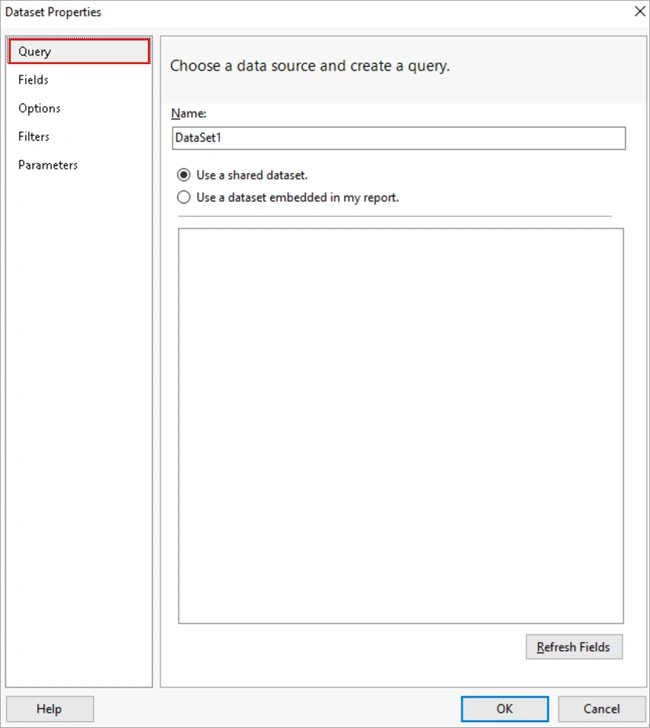
-
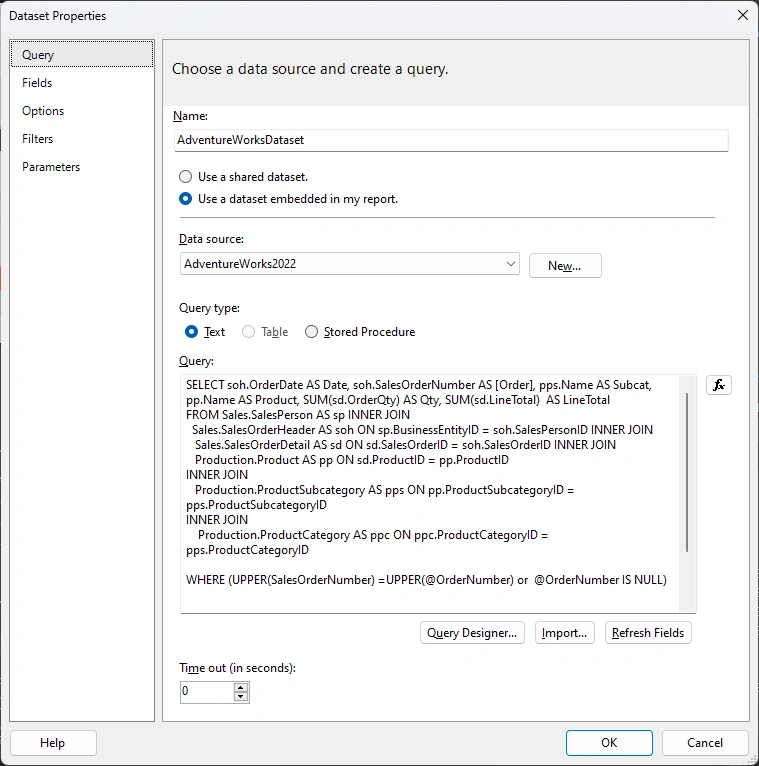
In the Name box, enter "AdventureWorksDataset".
-
Select the Use a dataset embedded in my report option.
-
From the Data source list, select AdventureWorks2022.
-
For Query type, select the Text option.
-
Enter, or copy and paste, the following Transact-SQL query into the Query text box.
SELECT
   soh.OrderDate AS [Date],
   soh.SalesOrderNumber AS [Order],
   pps.Name AS [Subcat],
   pp.Name as [Product],
   SUM(sd.OrderQty) AS [Qty],
   SUM(sd.LineTotal) AS [LineTotal]
FROM Sales.SalesPerson sp
INNER JOIN Sales.SalesOrderHeader AS soh
      ON sp.BusinessEntityID = soh.SalesPersonID
   INNER JOIN Sales.SalesOrderDetail AS sd
      ON sd.SalesOrderID = soh.SalesOrderID
   INNER JOIN Production.Product AS pp
      ON sd.ProductID = pp.ProductID
   INNER JOIN Production.ProductSubcategory AS pps
      ON pp.ProductSubcategoryID = pps.ProductSubcategoryID
   INNER JOIN Production.ProductCategory AS ppc
      ON ppc.ProductCategoryID = pps.ProductCategoryID
GROUP BY ppc.Name, soh.OrderDate, soh.SalesOrderNumber, pps.Name, pp.Name,soh.SalesPersonID
HAVING ppc.Name = 'Clothing'
-
(Optional) Select Query Designer. The query appears in the text-based Query Designer. Select run to view the results of the query (
 ) on the Query Designer toolbar. The dataset displayed contains six fields from four tables in the
 AdventureWorks2022database. The query makes use of Transact-SQL functionality such as aliases. For example, the SalesOrderHeader table is calledsoh. -
Select OK to exit the Query Designer.
-
Select OK to exit the Dataset Properties dialog.
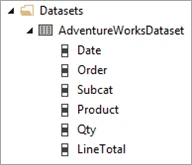
We have
-
The Report Data pane displays the AdventureWorksDataset dataset and fields.
Add a table data region and fields to a report layout
- Choose the Table object and drag it to the report design surface. You can also add a table to the report from the design surface. Right-click the design surface and select Insert > Table.
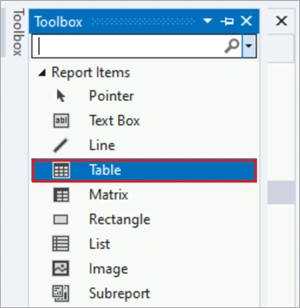
Report Designer draws a table data region with three columns in the center of the design surface.
- Drag the
Datefield from the Report Data pane to the first column in the table.
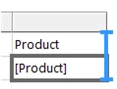
- Add the
LineTotalfield in the same way, creating a fifth column. The column label shows as "Line Total". Report Designer automatically creates a friendly name for the column by splitting "LineTotal" into two words.

Preview your report
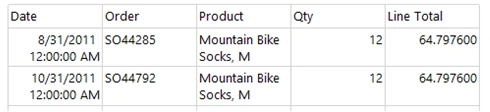
While designing, preview your report frequently. By doing so, you validate the design and data connections and you can correct errors and issues as you go.
-
Select the Preview tab.
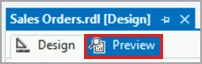
- Report Designer runs the report and displays it in the Preview view.
F - Format the Report
Formatting.
Date:
-
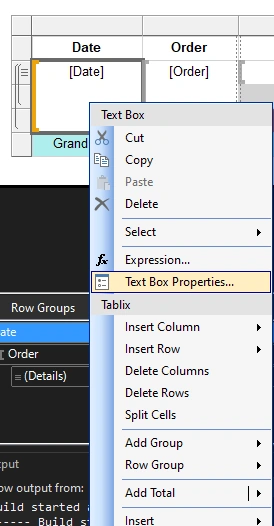
On the Design tab, right-click the cell with the
[Date]field expression and then select Text Box Properties.
-
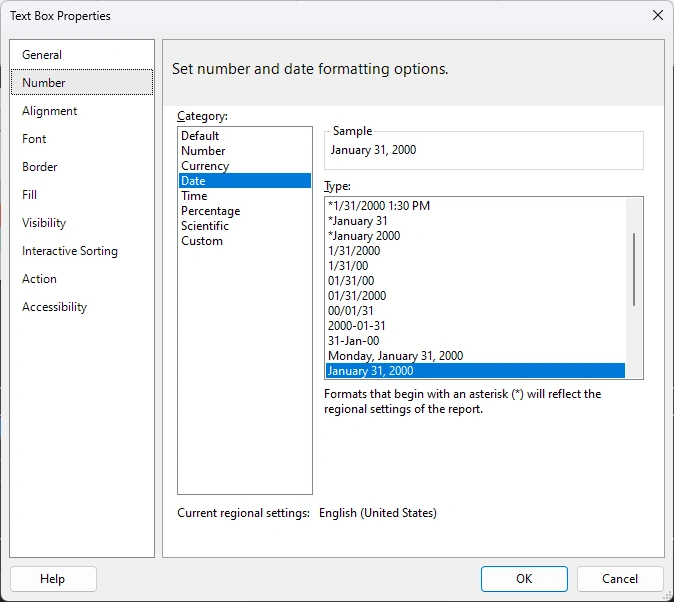
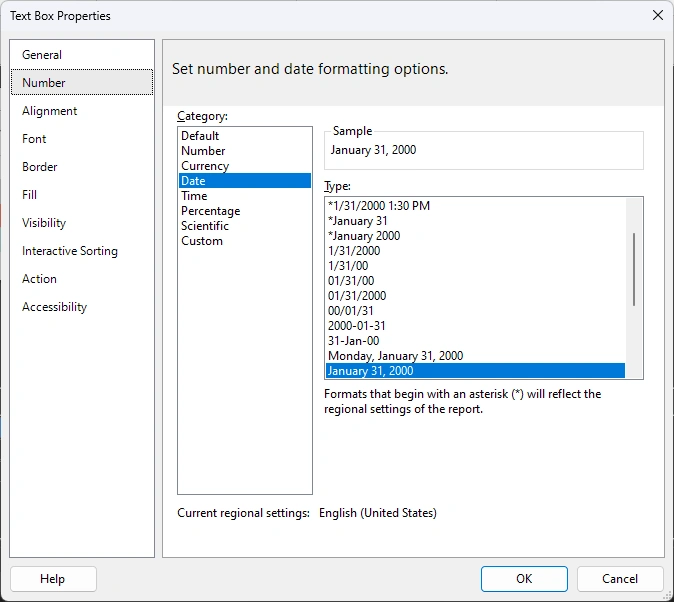
Select Number, and then choose Date from the Category box. In the Type box, select January 31, 2000.
Currency
Change text style and column widths
You can add other formatting to your report by highlighting the header, and then adjusting the widths of the data columns.
-
Select the table so that column and row handles appear on the top and side of the table. The gray bars along the top and side of the table are the column and row handles.
-
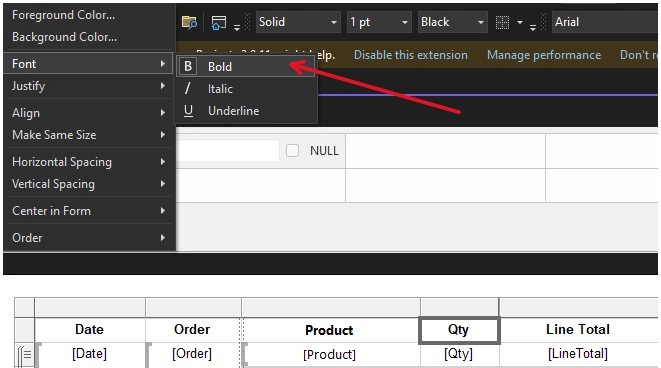
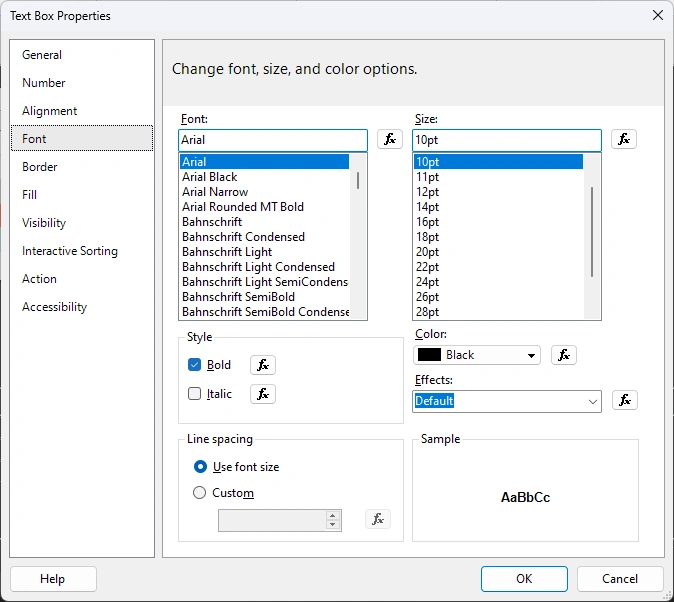
Highlight the row containing column header labels and then select Format > Font > Bold.
-
You can also use the Text Box Properties to do the job.
-
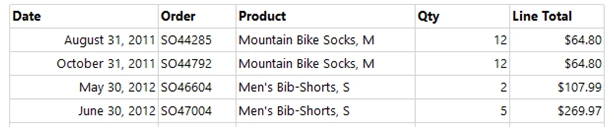
Hover over the line between column handles so that the cursor changes into a double arrow. Drag the columns to the size you want.

- Preview the report on the Preview tab.
G - Group data in a report
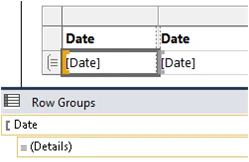
- From the Report Data pane, drag the
[Date]field to the Row Groups pane. Place it above the row displayed as = (Details).
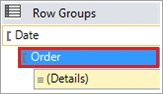
- From the Report Data pane, drag the
[Order]field to the Row Groups pane. Place it after Date and before = (Details).
- Delete the original
[Date]and[Order]expression columns to the right of the double line. Select the column handles for the two columns, right-click and choose Delete Columns. Report Designer removes the individual row expressions, so that only the group expressions are displayed.
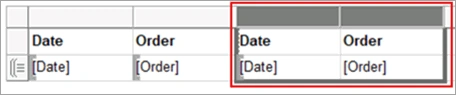
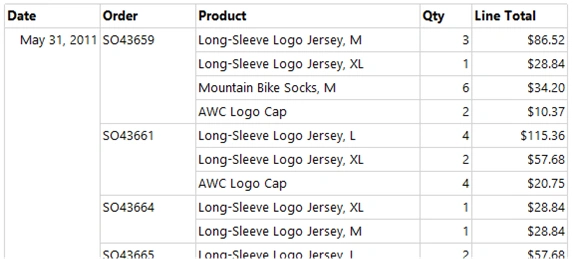
- Format the new
[Date]column, then Preview:
H - Add totals to a report
Add total:
Line Total:
You can add totals to your report to summarize data. Totals help you quickly understand aggregate values and enhance the report's usability.
-
Switch to the Design view.
-
Right-click the data region cell that contains the
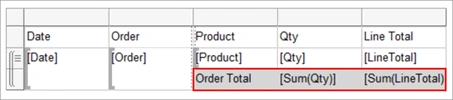
[LineTotal]expression, and select Add Total. Report Designer adds a row with a sum of the dollar amount for each order. -
Right-click the cell that contains the field
[Qty], and select Add Total. Report Designer adds a sum of the quantity for each order to the totals row. -
In the empty cell to the left of the
Sum[Qty]cell, enter "Order Total". -
Select the two sum cells and the label cell in the row where you added the total cells.
-
Select Format > Background Color > Light Gray.
Daily Total
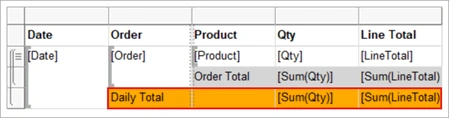
You can add a daily total to your report. This step provides a daily summary at the end of each date grouping and helps you quickly identify daily aggregates within your report.
-
Right-click the
[Order]expression cell, and select Add Total > After. Report Designer adds a new row containing sums of the[Qty]and[Linetotal]values for each day, and the string "Total" to the bottom of the[Order]expression column. -
Enter the word "Daily" before the word "Total" in the same cell, so it reads "Daily Total".
-
Select that cell and the two adjacent total cells to the right side and the empty cell in between them.
-
Select Format > Background Color > Orange.
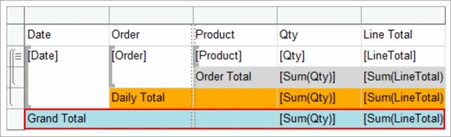
Grand Total
You can add a grand total to your report to summarize all the data across the entire report. A grand total provides a comprehensive summary and makes it easier to understand the overall data at a glance.
-
Right-click the
[Date]expression cell, and select Add Total > After. Report Designer adds a new row containing sums of the[Qty]and[LineTotal]values for the entire report, and the string "Total" to the bottom of the[Date]expression column. -
Enter the string "Grand" before the word "Total" in the same cell, so it reads "Grand Total".
-
Select the cell with "Grand Total", the two
Sum()expression cells and the empty cells between them. -
Select Format > Background Color > Light Blue.
-
Select OK.
Preview the report
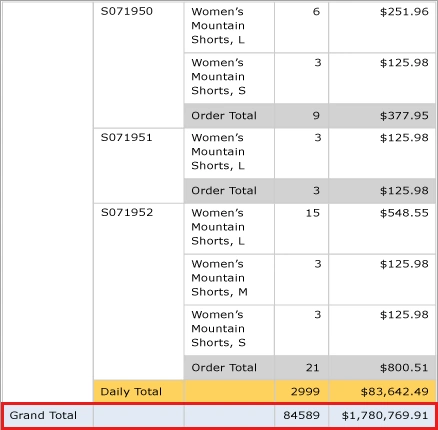
Switch to the Preview tab so you can view the report as it appears when published. Look for any errors or issues you can fix before finalizing the report.
-
Select the Preview tab.
-
In the Preview toolbar, choose Last Page, which looks like
 . The Grand Total values display at the end of the report.
I - Add a report parameter
-
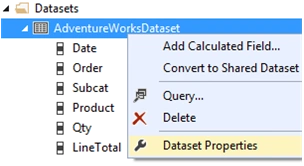
Right-click the dataset
AdventureWorksDatasetand select Dataset Properties.
- Update data query: Add the statement below before the
Group Bystatement. The following example is the full query syntax:WHERE(UPPER(SalesOrderNumber) =UPPER(@OrderNumber) or @OrderNumber IS NULL)
SELECT soh.OrderDate AS Date, soh.SalesOrderNumber AS [Order], pps.Name AS Subcat, pp.Name AS Product, SUM(sd.OrderQty) AS Qty, SUM(sd.LineTotal)  AS LineTotal
FROM Sales.SalesPerson AS sp INNER JOIN
  Sales.SalesOrderHeader AS soh ON sp.BusinessEntityID = soh.SalesPersonID INNER JOIN
   Sales.SalesOrderDetail AS sd ON sd.SalesOrderID = soh.SalesOrderID INNER JOIN
   Production.Product AS pp ON sd.ProductID = pp.ProductID
INNER JOIN
   Production.ProductSubcategory AS pps ON pp.ProductSubcategoryID = pps.ProductSubcategoryID
INNER JOIN
    Production.ProductCategory AS ppc ON ppc.ProductCategoryID = pps.ProductCategoryID

WHERE (UPPER(SalesOrderNumber) =UPPER(@OrderNumber) or  @OrderNumber IS NULL)

GROUP BY ppc.Name, soh.OrderDate, soh.SalesOrderNumber, pps.Name, pp.Name, soh.SalesPersonID
HAVING (ppc.Name = 'Clothing')
- In the Report Data pane, expand the parameters folder and double-click the Ordernumber parameter. It was created automatically as part of the previous steps when you added the parameter to the dataset. Select New and then choose Parameter...
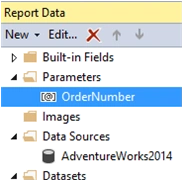
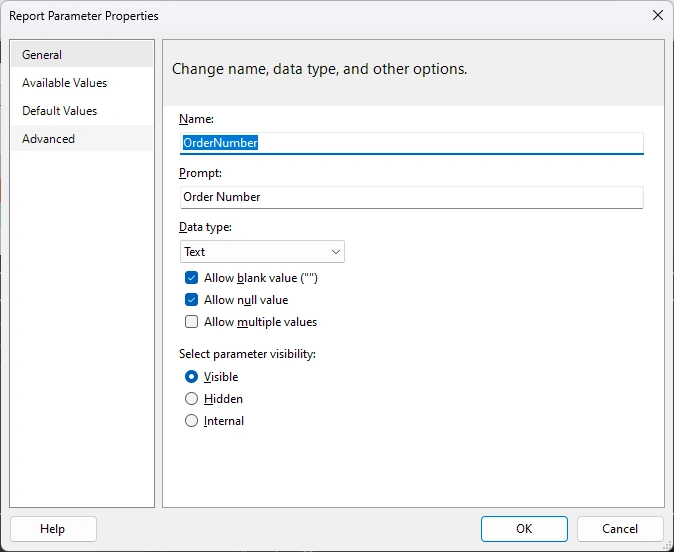
- Doube Click the parameter @OrderNumber:
-
Verify the Name is
OrderNumber. -
Verify the Prompt is
Order Number. -
Select Allow blank value ("").
-
Select Allow null value.
-
Preview:
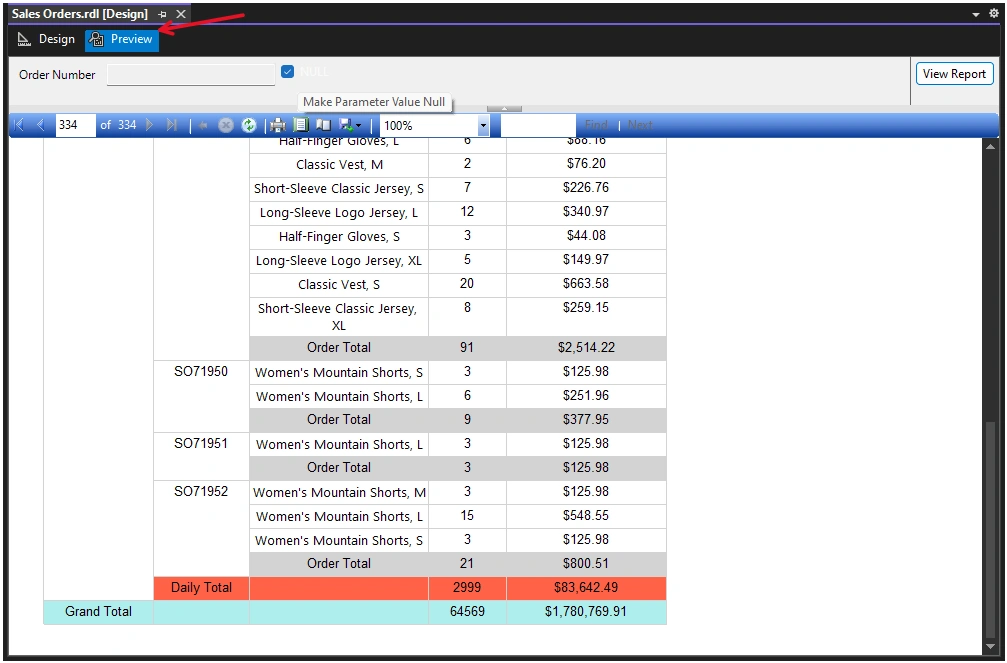
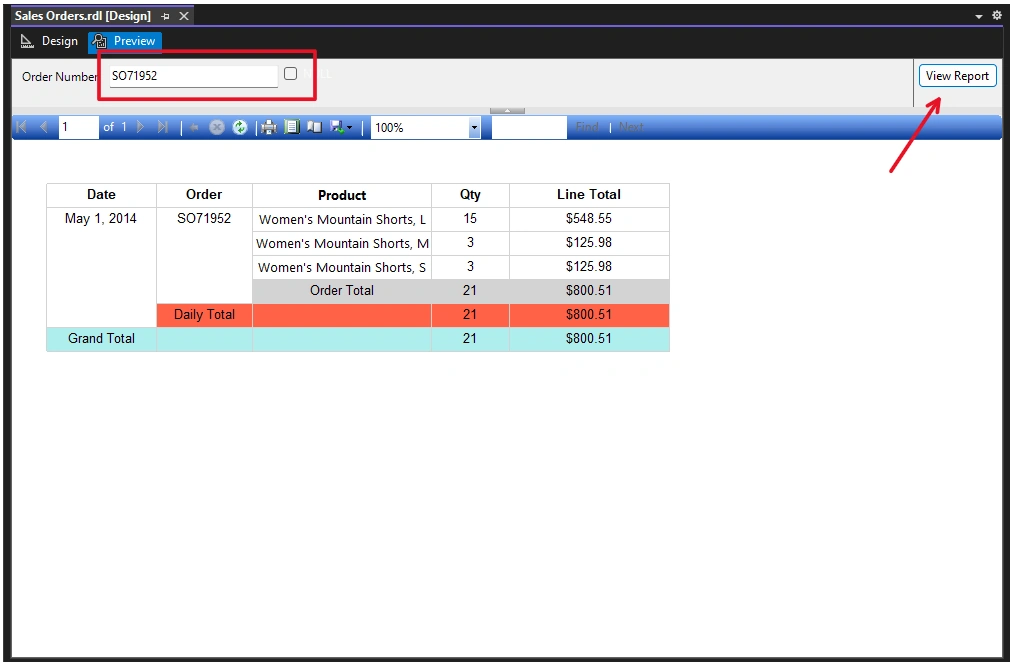
- Uncheck the NULL box on the top of the view, and typein a Order Number, say SO71952, Click View Report
J - Publish the report to the Report Server
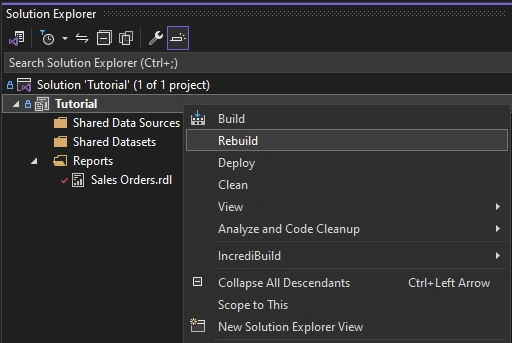
- Rebuild
- Deploy
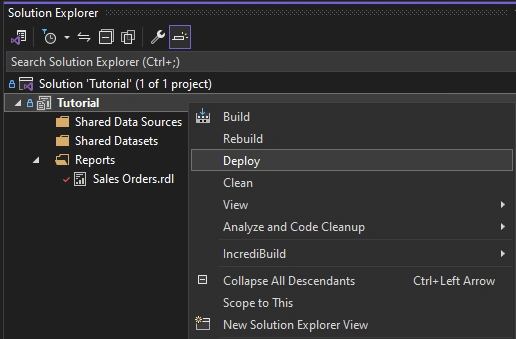
If you see a message similar the following Output window, it indicates a successful deployment.
------ Build started: Project: tutorial, Configuration: Debug ------
Skipping 'Sales Orders.rdl'. Item is up to date.
Build complete -- 0 errors, 0 warnings
------ Deploy started: Project: tutorial, Configuration: Debug ------
Deploying to `https://[server name]/reportserver`
Deploying report '/tutorial/Sales Orders'.
Deploy complete -- 0 errors, 0 warnings
========== Build: 1 succeeded or up-to-date, 0 failed, 0 skipped ==========
========== Deploy: 1 succeeded, 0 failed, 0 skipped ==========
-
Browse to the web portal URL.
https://<server name>/reports.http://localhost/reportsworks if you're designing the report on the report server.
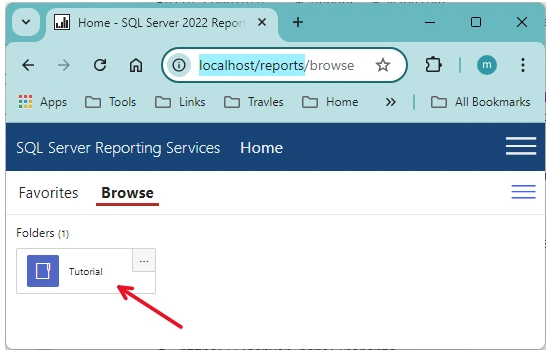
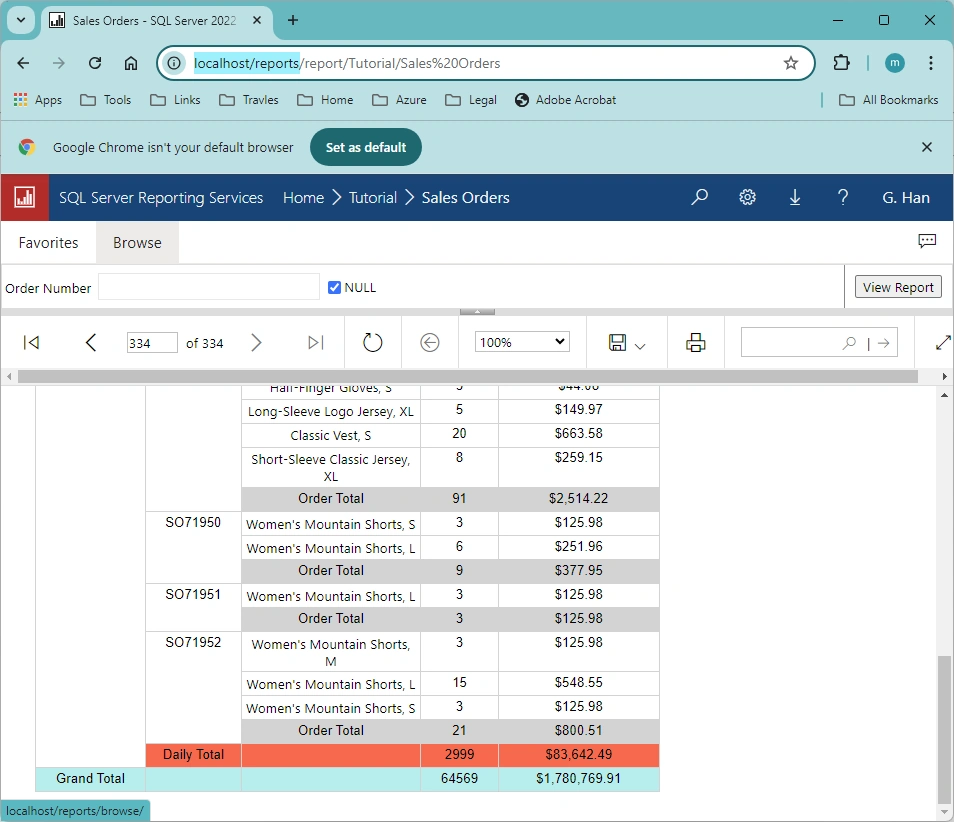
- Select the Tutorial folder, and then open the Sales Orders report.
-
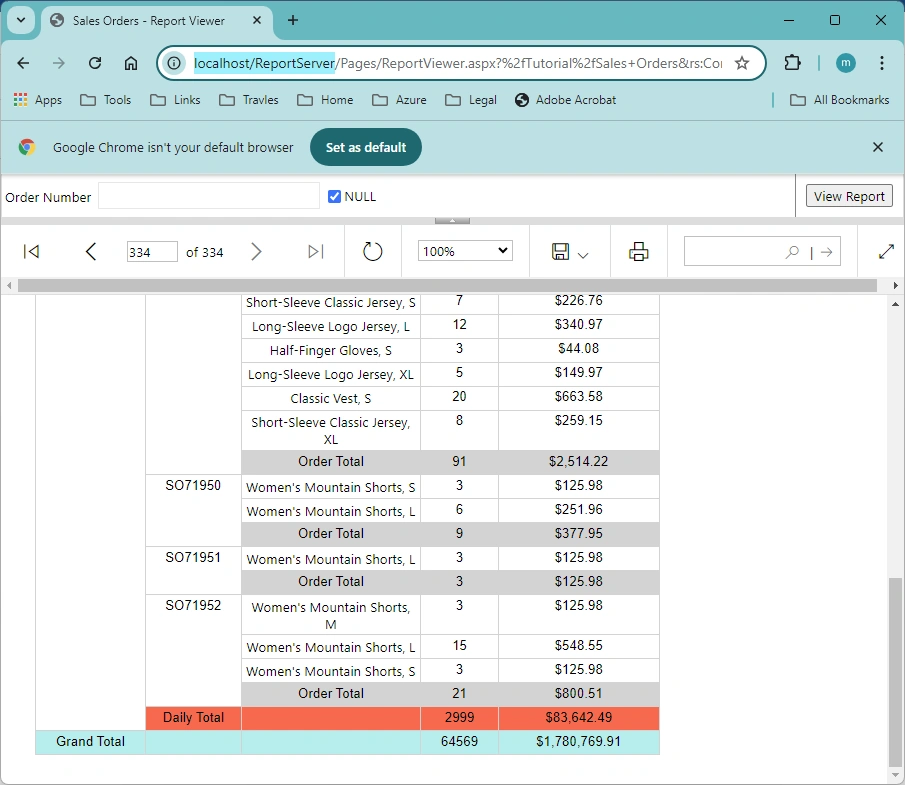
Browse to the web Service URL.
https://<server name>/ReportServer.http://localhost/ReportServerworks if you're designing the report on the report server.
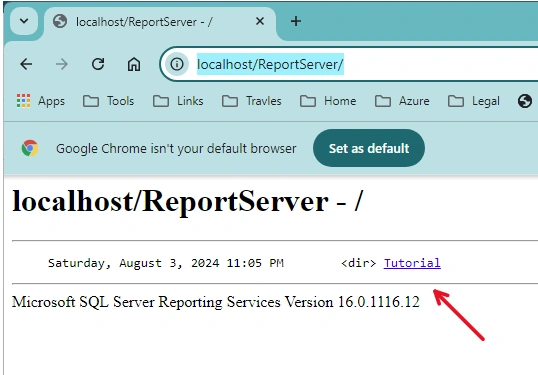
- Select the Tutorial link, and then open the Sales Orders report.
K - Export to Excel or others
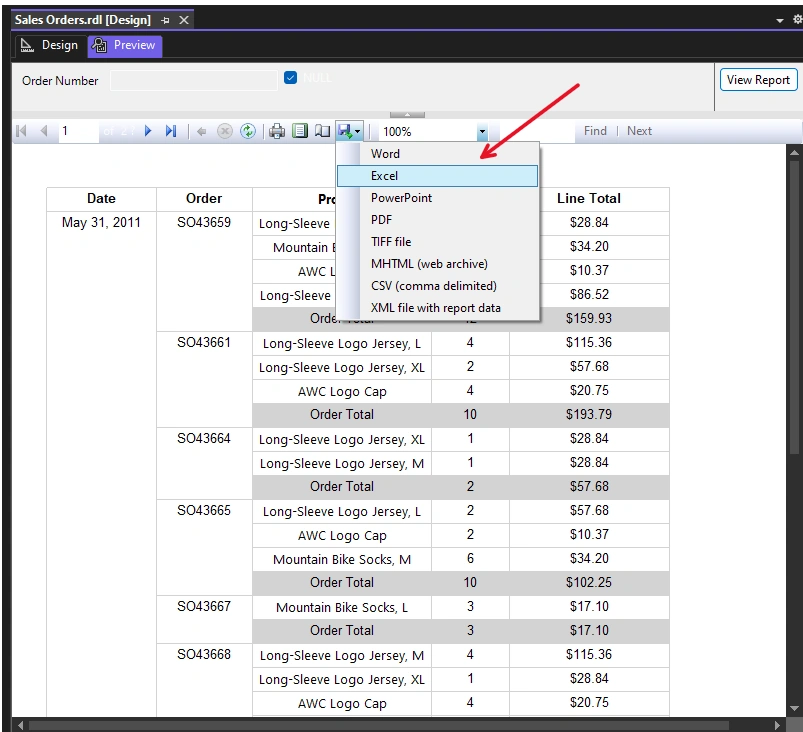
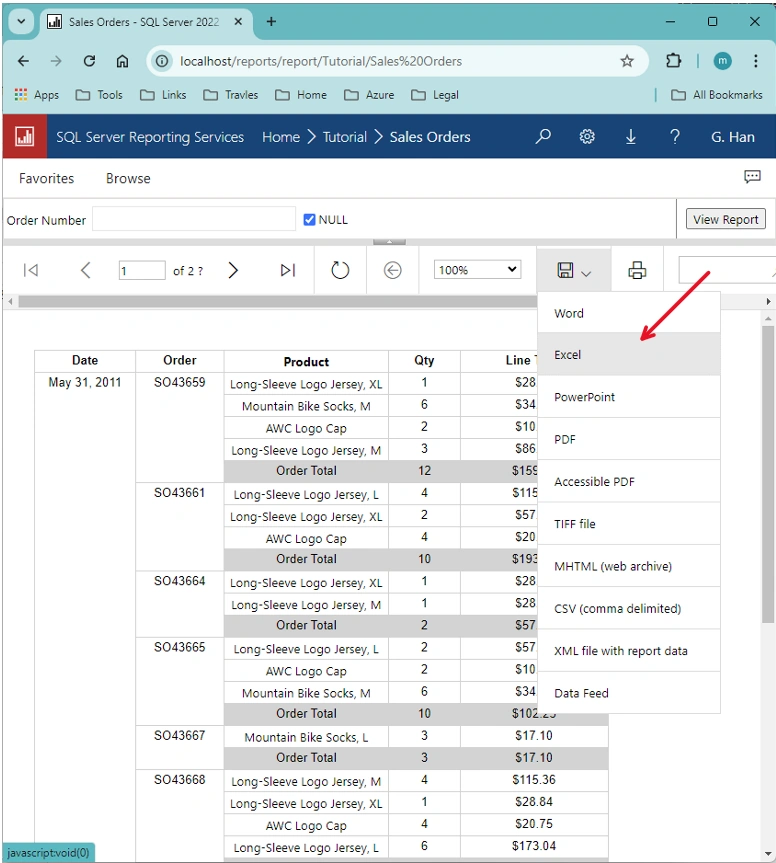
In both development environment or server deployment, there is a button that we can use to export the report to MS Excel or other files:
- From Development Env.
- From Server
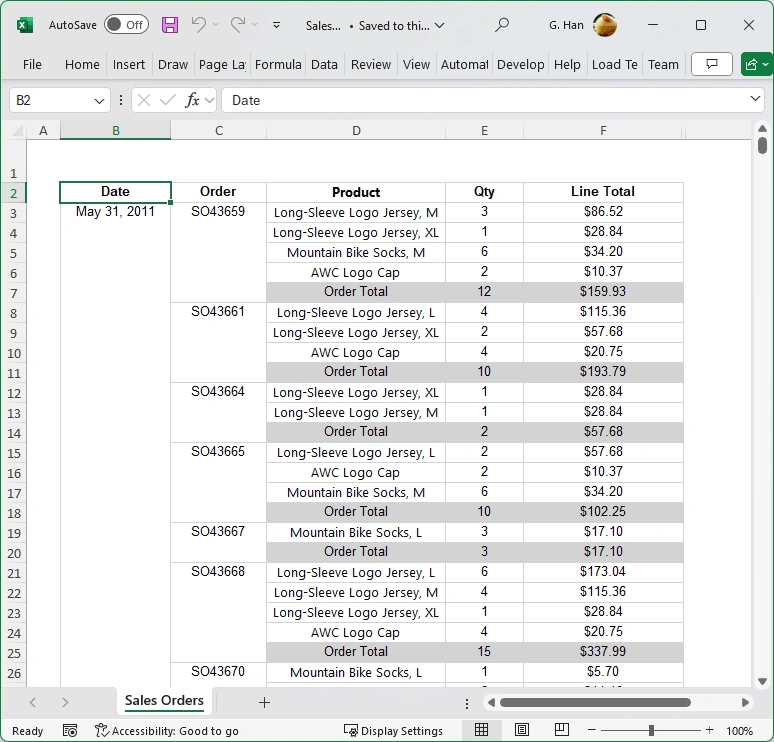
- Excel Exported
References:
- SSRS --- SQL Server Reporting Service
- What is SQL Server Reporting Services? - (SSRS) | Microsoft Learn
- Power BI Report Server Integration (Configuration Manager) - (SSRS) | Microsoft Learn
- Defining an incremental refresh report (microstrategy.com)
- Report Definition Language
- Report Designer Tutorial
- SSMS Script objects - SQL Server Management Studio (SSMS) | Microsoft Learn --- important
Maya ChopraPosted Sep 30, 2024, 3:23 AM
I like the way how you explain thing in your article, thanks for posting..
jose loraPosted Aug 25, 2024, 1:02 AM
I WOLD LIKE TO KNOW IF I CAN USE REPORT BUILDER IN ASP.NET CORE 8
jose loraPosted Aug 25, 2024, 1:02 AM
THIS CAN BE USED BY ASP.NET CORE