After you have finished with Numpy and Pandas, you might be interested in playing with visualizing for static and interactive visuals in Python. Thus Matplotllib can be used to deliver or to abstract visuals of data upon required output so that the user can understand it better with both data graphically and in a visual manner.
Matplotlib can be installed using pip, as
python -m pip install -U pip
python -m pip install -U matplotlib
or you can install it on Anaconda main channel by
conda install matplotlib
also, you may install it via the conda-forage community channel
conda install -c conda-forge matplotlib
For Linux Package Manager
For Ubuntu or Debian :
sudo apt-get install python3-matplotlib
For Arch :
sudo pacman -S python-matplotlib
For RedHat :
sudo yum install python3-matplotlib
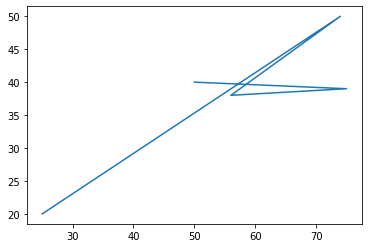
Line Plot using Matplotib
To build a line plot using Matplotib
# importing matplotlib module
from matplotlib import pyplot as plt

# x-axis values stored in A
A = [25, 74, 56, 75, 50]

# Y-axis values stored in B
B = [20, 50, 38, 39, 40]

# Function to plot
plt.plot(A,B)

# function to show the plot
plt.show()
Output
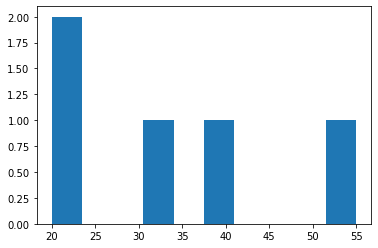
Histogram using Matplotib
To build a Histogram using Matplotlib
# importing matplotlib module
from matplotlib import pyplot as plt

# Y-axis values stored in B
B = [22, 40, 55, 32, 20]

# Function to plot histogram
plt.hist(B)

# Function to show the plot
plt.show()
Output
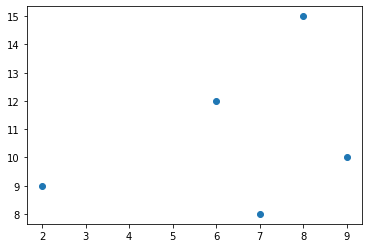
Scatter Plot using Matplotib
To build a Scatter Plot using Matplotlib
# importing matplotlib module
from matplotlib import pyplot as plt

# x-axis values stored in A
A = [6,8,7,2,9]

# Y-axis values stored in B
B = [12,15,8,9,10]

# Function to plot scatter
plt.scatter(A, B)

# function to show the plot
plt.show()
Output
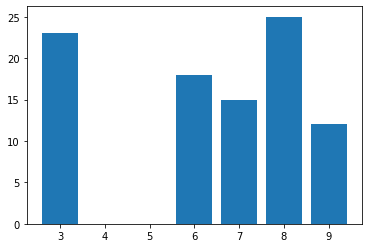
BarPlot using Matplotib
To build a BarPlot using MatplotLib
# importing matplotlib module
from matplotlib import pyplot as plt

# x-axis values stored in A
A = [7,8,6,9,3]

# Y-axis values stored in B
B = [15, 25, 18, 12, 23]

# Function to plot the bar
plt.bar(A,B)

# function to show the plot
plt.show()
Output
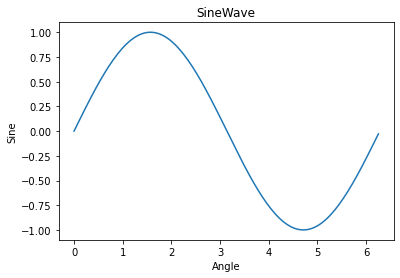
SinWave using Matplotib
To build a SinWave using Matplotlib
from matplotlib import pyplot as plt
import numpy as np
import math
x = np.arange(0, math.pi*2, 0.045)
y = np.sin(x)
plt.plot(x,y)
plt.xlabel("Angle")
plt.ylabel("Sine")
plt.title('SineWave')
plt.show()
Output
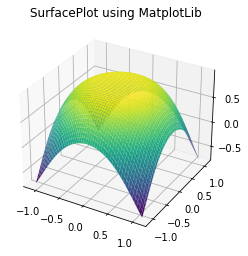
3D Surface Plot using Matplotib
To build a 3D Surface Plot using Matplotlib
from mpl_toolkits import mplot3d
import numpy as np
import matplotlib.pyplot as plt
A = np.outer(np.linspace(-1.1, 1.1, 100), np.ones(100))
B = A.copy().T
C = np.cos(A ** 2 + B ** 2)
fig = plt.figure()
ax = plt.axes(projection='3d')
ax.plot_surface(A, B, C,cmap='viridis', edgecolor='none')
ax.set_title('SurfacePlot using MatplotLib')
plt.show()
Output
The above were a few examples of how one can implement matplotlib, one can have a good amount of grip upon practice. Thus patience, practice, and time need to be invested while learning. Till then keep enjoying and keep coding.