I think there is a lot of potential for using .NET as a front end system for real-time systems, namely because it is so easy to create custom controls and interfaces from the computer that can appear to look like anything your mind can conjure. In a previous article we examined how we could create a virtual oscilloscope using GDI+. This is a less complex, nevertheless interesting example of how to use the same board to create a simple voltmeter.
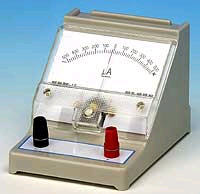
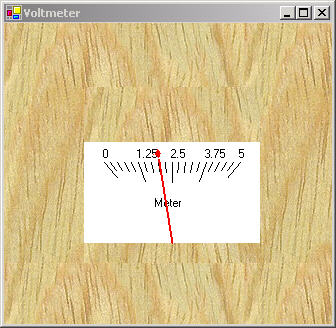
Figure 1 - Virtual Voltmeter using GDI+ and the GP-3 Board from AWC
The voltmeter takes the input from the A/D converter and displays the value on a meter user control that contains a "magnetic needle" that moves to the voltage reading. Our voltmeter consists of three main classes: A Windows Form that contains both the meter and gp-3 activeX control, an analog meter user control, and a gp-3 wrapper class for accessing the GP-3 board. The WithClass design diagram of the meter architecture is illustrated in figure 2 below:
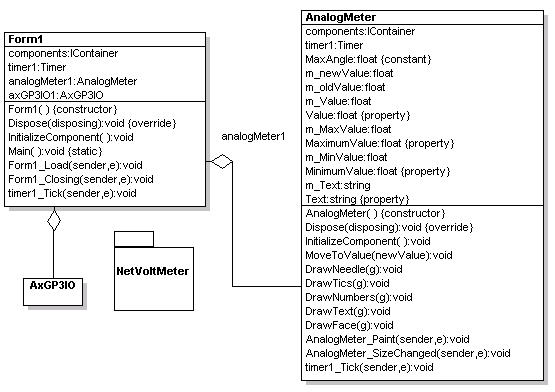
Figure 2 - Analog Meter Project reverse engineered using WithClass
The meter works by taking a sample measurement of the A/D converter in the timer event handler every 200 milliseconds. The event handler is shown in listing 1. This event handler also sets the AnalogMeter user control to the sampled value:
Listing 1 - Measuring the voltage and setting the meter
private
void timer1_Tick(object sender, System.EventArgs e)
{
// take a reading every 1/10 second
long tmp = this.axGP3IO1.a2d(0);
// scale to a value between 0 and 5 volts
float voltage = (float)tmp * 5/ 1024.0f;
// set the meter to this value
this.analogMeter1.Value = voltage;
}
Analog Meter Control
The analog meter is a user control that allows you to mimic a typical magnetic galvanometer. The meter has properties that allow you to manipulate the text appearing inside the meter, the maximum and minimum values of the meter, and the value where the needle points. Movement of the needle from one value to the next is simulated through a timer built into the meter.
The user control overrides the Form_Paint event handler and draws the meter you see in figure 1. All of the parts of the meter are drawn in this routine including the face of the meter, the numbers, the tick count, and of course, the needle.
Listing 2 - Drawing the Meter
private
void AnalogMeter_Paint(object sender, System.Windows.Forms.PaintEventArgs e)
{
// get a reference to the graphics surface
Graphics g = e.Graphics;
// create face of meter
DrawFace (g);
// Draw Tics
DrawTics(g);
// Draw Numbers
DrawNumbers(g);
// Draw Text Title
DrawText(g);
// create the needle according to the value
DrawNeedle (g);
}
An interesting piece of code to look at is how we rotate the needle to point to the correct value. The needle is nothing more than a graphics path and a graphics path is simply a collection of drawing primitives that are connected end-to-end to form a complex path. The path can be rotated, scaled, or translated over the graphics surface. In this case, we need to rotate the graphics path (the needle) around its hinge point at the bottom of the meter so that it points to the value that interests us. The Matrix class in .NET helps us rotate the needle by transforming a graphics path in 2-D space. Listing 3 illustrates the code that is required to perform the task of drawing and rotating the needle using the GraphicsPath and Matrix class:
Listing 3 - Drawing the Needle to point to the Value
private
void DrawNeedle(Graphics g)
{
// determine hinge point of the needle
Point centerPoint = new Point( (ClientRectangle.Width)/2, ClientRectangle.Height - 20);
// determine the topPoint of the needle
Point topPoint = new Point( (ClientRectangle.Width)/2, 60);
// Create a new graphics path
GraphicsPath gp = new GraphicsPath();
// draw the primitives inside the graphics path
//draw the left side of the head of the needle
gp.AddCurve(new Point[]{topPoint, new Point(topPoint.X-3, topPoint.Y + 5), new Point(topPoint.X - 5, topPoint.Y + 5)}, 0.3f);
gp.AddCurve(new Point[]{new Point(topPoint.X-5, topPoint.Y + 5), new Point(topPoint.X - 3 , topPoint.Y + 5), new Point(topPoint.X, topPoint.Y+10)}, 0.3f);
Point sidePoint1 = topPoint;
Point sidePoint2 = centerPoint;
Point sidePoint4 = topPoint;
sidePoint1.Offset(-1, 10);
sidePoint2.Offset(-1, 0);
Point sidePoint3 = sidePoint2;
sidePoint3.Offset(2, 0);
sidePoint4.Offset(1, 10);
// draw the stem of the needle
gp.AddLine(sidePoint1, sidePoint2);
gp.AddLine(sidePoint2, sidePoint3);
gp.AddLine(sidePoint3, sidePoint4);
// draw the right side of the head of the needle
gp.AddCurve(new Point[]{new Point(topPoint.X, topPoint.Y + 10), new Point(topPoint.X + 3 , topPoint.Y + 5), new Point(topPoint.X+5, topPoint.Y+5)}, 0.3f);
gp.AddCurve(new Point[]{new Point(topPoint.X + 5, topPoint.Y + 5), new Point(topPoint.X + 3, topPoint.Y + 5), topPoint}, 0.3f);
// close the path
gp.CloseFigure();
// initially create the matrix as an identity matrix
Matrix m = new Matrix();
// make sure the value does not exceed the bounds of the meter
// (in physical terms, if the value exceeds the bounds of the meter,
// then pin the needle.)
float calcValue = m_Value;
if (calcValue > m_MaxValue) // pin to maximum value
{
calcValue = m_MaxValue;
}
if (calcValue < m_MinValue) // pin to minimum value
{
calcValue = m_MinValue;
}
// convert value to an angle spanning meter
float angle = (calcValue/(m_MaxValue - m_MinValue)) * MaxAngle - (MaxAngle/2);
// rotate the identity matrix around the hinge point of the meter according
// to the angle-value
m.RotateAt(angle, centerPoint);
// rotate the graphics path using the rotated identity matrix
gp.Transform(m);
// make the needle a solid red color
g.FillPath(Brushes.Red, gp);
}
Simulating the Meter
The meter uses the built in user control timer to simulate the movement of the needle from the old value to the new value. This way, the meter really looks like it has a voltage dragging the needle with a magnetic field. (We also use double-buffering in our constructor, to make the motion of the needle appear smoother.) Listing 4 is the timer event handler that moves the needle a small step each time a tick event is received by the timer (every 150 milliseconds). The needle moves an incremental step in the direction of the new value and stops when it reaches the value set by the user. The event handler uses the mathematical sign function to determine the direction of the needle and multiplies the result of the sign function by the step used to increment the needles motion.
Listing 4 - The Timer Event handler simulating the motion of the needle
private
void timer1_Tick(object sender, System.EventArgs e)
{
// determine the step interval for each tick of the needle
float step = (this.m_MaxValue - this.m_MinValue)/200.0f;
// determine direction of step
step = step * Math.Sign(m_newValue - m_Value);
// step through and simulate needle movement
// first increase the value of the needle towards the new value
m_Value = m_Value + step;
Invalidate();
// if the needle is headed up the scale,
// check to see if we exceeded the new value
if ((step > 0) && (m_Value >= m_newValue))
{
// needle reached its destination
// stop the timer, and set the final value
timer1.Stop();
m_Value = m_newValue;
return;
}
// if the needle is headed down the scale,
// check to see if we dipped below the new value
if ((step < 0) && (m_Value <= m_newValue))
{
// needle reached its destination
// stop the timer, and set the final value
timer1.Stop();
m_Value = m_newValue;
return;
}
}
Improvements
In order to make a decent voltmeter, you need to be able to scale to several voltages. One possibility is to feed the voltage being measured into an amplifier that either amplifies or divides the voltage coming into the A/D converter. Figure 3 shows a possible divider circuit I've scratched out (but haven't tested) that could help measure voltages in ranges from (0 - 500 mv), (0 - 5V), and (0-50V) respectively. Vin would be connected to the measured voltage point and Vout would be connected to the A/D converter channel on the GP-3(along with some protection circuitry). By using a multiplexer circuit (an electronic selection switch) in combination with the GP-3 logic output to select the Mux(multiplexer), and a virtual selection knob on the Windows Form, you could add range selection to the virtual voltmeter in Figure 1. Each click of the virtual selection knob would redraw the meter to reflect the new range and electronically select a new voltage divider resistor in the circuit in figure 3.
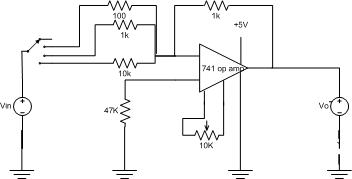
Figure 3 - Range selection for the voltage being measured
Conclusion
Once more we explored the power of going beyond our computer screens and sensing the outside world with the help of .NET. In our next related project, I'm hoping to demonstrate a more practical example of using .NET and the GP-3 together. In the meantime, if you want to experiment with the GP-3, you can download the GP-3 kit from AWC. Have fun controlling hardware and getting charged with .NET!