Everything works...
Until it doesn't.
Every developer has experienced it: the application behaves perfectly during development, passes all the tests, and even works in staging. Then, shortly after deployment, users begin reporting errors.
The API is temporarily unavailable.
A third-party service starts rate limiting requests.
A response contains unexpected data.
A network timeout occurs.
These situations are not unusual. They're part of building modern distributed applications. Yet many teams only encounter them for the first time in production, when the impact is greatest.
The challenge isn't that developers don't know how to handle these failures. The challenge is that they're difficult to reproduce during development.
This is where Microsoft Dev Proxy becomes invaluable.
By placing Dev Proxy between your application and external services, you can intentionally simulate failures, delays, and unexpected responses without changing your application or backend APIs. Instead of waiting for production to expose weaknesses, you can discove and fix them during development.
In this article, we'll explore:
Why resilience testing matters more than ever.
How to install and configure Microsoft Dev Proxy.
How to simulate real-world API failures.
How to build a simple demo application that handles these failures gracefully.
Best practices for integrating Dev Proxy into your everyday development workflow.
By the end of this article, you'll have a practical setup that helps you build applications that are not only functional but resilient.
Why Use Microsoft Dev Proxy?
Modern applications rarely operate in isolation. Whether you're consuming third-party APIs, microservices, or cloud services, failures are inevitable. APIs can become unavailable, return unexpected responses, or enforce rate limits. Unfortunately, these scenarios are often discovered only after deployment, when they affect real users.
Microsoft Dev Proxy helps you shift this testing earlier in the development lifecycle. Instead of waiting for production to expose weaknesses, you can simulate real-world scenarios such as 503 Service Unavailable, 429 Too Many Requests, network delays, or even malformed responses directly from your development environment. This allows you to verify that your application handles failures gracefully before it reaches production.
When Should You Use It?
Microsoft Dev Proxy is particularly useful when you want to:
Test your application's resilience to API failures.
Verify retry, fallback and error-handling logic.
Simulate third-party service outages or rate limiting.
Validate how your UI behaves when APIs return unexpected responses.
Reproduce scenarios that are difficult or impossible to trigger on demand.
Build confidence before deploying to production.
The goal isn't to test whether an API works. It is to test whether your application continues to work when the API doesn't.
Set up
Install dev proxy.
To correctly install it based on your OS, follow the instructions here: client-operating-system-windows
Run dev proxy.
In the terminal, run: 'devproxy'
After some seconds, logs will appear.
If you see only verbose info and no error, it means the setup is correctly done.
Once installation is successful, check if dev proxy can simulate the APIs failure correctly
You can use dummy APIs online.
As example, we are using this online dummy API: products.
Run the command devproxy --urls-to-watch " dummyjson.com"
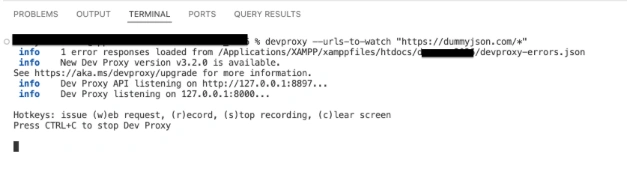
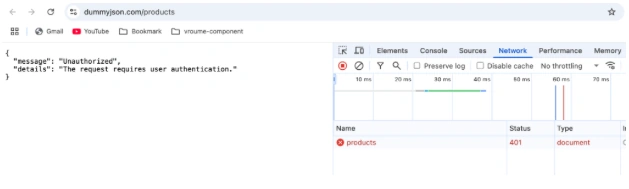
When you access https://dummyjson.com/products , it can throw a '401' error.
If you refresh, you can also get a 200 or another error.
When the dev proxy runs, the errors are random.
Why it works
Think of Microsoft Dev Proxy as a traffic controller positioned between your application and the APIs it communicates with. Every request passes through Dev Proxy first, and it decides whether to let the request continue to the real API or intervene and return a simulated response instead.
When Dev Proxy starts, it first looks for a devproxyrc.json file in the current folder (the folder where you run the devproxy command). If it doesn't find one, it falls back to its default configuration. This file acts as Dev Proxy's instruction manual, defining which APIs to monitor, which plugins to load, how frequently requests should be intercepted, and which file contains the responses to simulate.
When a request matches the configured rules, Dev Proxy can return one of these responses instead of forwarding the request to the real API. This allows you to safely test how your application handles failures, rate limiting, or unexpected responses without changing your application code or the backend service.
Configuring Microsoft Dev Proxy for your needs
Now that we understand how Microsoft Dev Proxy works, let's configure it for our own project.
Microsoft Dev Proxy comes with a default devproxyrc.json and devproxy-errors.json file. Rather than modifying the global configuration, I recommend copying both files into your project's working directory (the folder from which you'll run the devproxy command). This keeps the configuration specific to your project, makes it easy to share with your team, and allows you to version it alongside your source code.
Once the files are copied, you can customize devproxyrc.json to define which APIs to monitor and which response file to use. Then, edit devproxy-errors.json or duplicate it to make it your own, renaming it as devproxy-errors-503.json to specify the responses you want Dev Proxy to return during your tests.
In your working directory:
Open the devproxyrc.json (the file that you have just copied).
Look for 'urlsToWatch' in the file. Replace the url with the one you use in your project.
In the same file, look for 'errorsFile' under 'genericRamdomErrorPlugin'.
By default, the file name is 'devproxy-errors.json'.
As mentioned earlier, you can duplicate this file in your working directory and call it devproxy-errors-503.json, for example, to replicate the error 503.
The file will be like the one below:
 "$schema": "https://raw.githubusercontent.com/dotnet/dev-proxy/main/schemas/v3.1.0/rc.schema.json",
  "plugins": [

   {

     "name": "RetryAfterPlugin",
     "enabled": true,
     "pluginPath": "~appFolder/plugins/DevProxy.Plugins.dll"

   },

   {

     "name": "GenericRandomErrorPlugin",
     "enabled": true,
     "pluginPath": "~appFolder/plugins/DevProxy.Plugins.dll",
     "configSection": "genericRandomErrorPlugin"

   }

 ],

 "urlsToWatch": [
   "https://dummyjson.com/*"

 ],

 "genericRandomErrorPlugin": {
   "$schema": "https://raw.githubusercontent.com/dotnet/dev-proxy/main/schemas/v3.1.0/genericrandomerrorplugin.schema.json",
   "errorsFile": "devproxy-errors-503.json",
   "rate": 50
 },

 "logLevel": "information",
 "newVersionNotification": "stable",
 "showSkipMessages": true,
 "showTimestamps": true,
 "validateSchemas": true

}{
In the file, remove the nodes for the other error verbose that you do not need or modify the message or details of the errors that you need.
For our example, I will require only the error 503.
As such, we delete the nodes for the other errors.
The file will look this the one below:
 {
 "$schema": "https://raw.githubusercontent.com/dotnet/dev-proxy/main/schemas/v3.1.0/genericrandomerrorplugin.errorsfile.schema.json",
 "errors": [
   {
     "request": {
       "url": "https://*/*"
     },
     "responses": [
       {
         "statusCode": 503,
         "body": {
           "message": "Service Unavailable",
           "details": "The server is currently unable to handle the request due to a temporary overload or maintenance. Please try again later."
         }
       }
     ]
   }
 ]
}
With these configurations, running the app will always return a 503 error for all APIs call that are set in the 'urlToWatch'.
Run dev proxy in your working directory using the command: devproxy
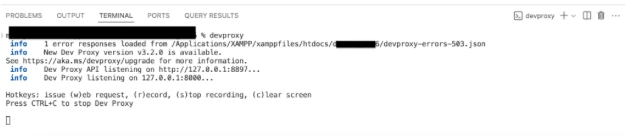
You will notice that now, the devproxy-errors-503.json is used.
When the API is called in the browser, you will get a '503' for the call as below even if you keep on refreshing:
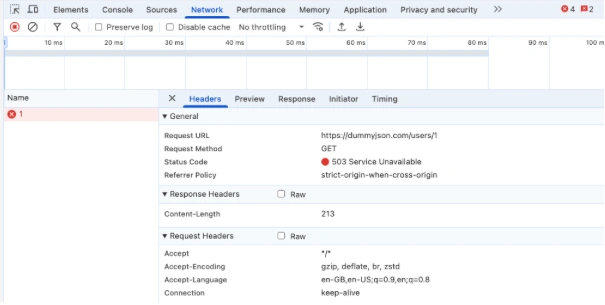
NOTE: If the default devproxyrc.json and devproxy-errors.json are used, every time the API is called, you will get a different error message from the devproxy-errors.json. This is helpful when testing for random errors.
Conclusion
As developers, we naturally spend a great deal of time ensuring our applications work under ideal conditions. Yet in production, ideal conditions are the exception rather than the rule. Services become unavailable, responses change, and transient failures occur. Building resilient applications means preparing for these scenarios before your users experience them.
Microsoft Dev Proxy provides a simple yet powerful way to simulate these real-world conditions without modifying your application or backend services. With just a few configuration files, you can reproduce failures, validate your application's behaviour, and improve its resilience early in the development process.
In this article, we've seen how to install and configure Microsoft Dev Proxy, create project-specific configurations, and simulate realistic API failures through a practical example. Whether you're developing a small application or a complex distributed system, incorporating Dev Proxy into your development workflow can help you detect issues earlier, reduce production surprises, and ultimately deliver more reliable software.
Resilient applications aren't built by hoping failures won't happen. They are built by preparing for them before they do.


Join the conversation! Your thoughts help the community grow.