This article has been excerpted from book "Graphics Programming with GDI+".
Let's look at one more real-world application. In this example we will develop an application that draws pie charts based on a data feed. Pie charts are useful when you need to represent statistical data in a graphical way, for example, the percentage of users visiting a Web site from different countries, or the percentage grades in different subjects. In our example we will use the DrawPie and FillPie methods.
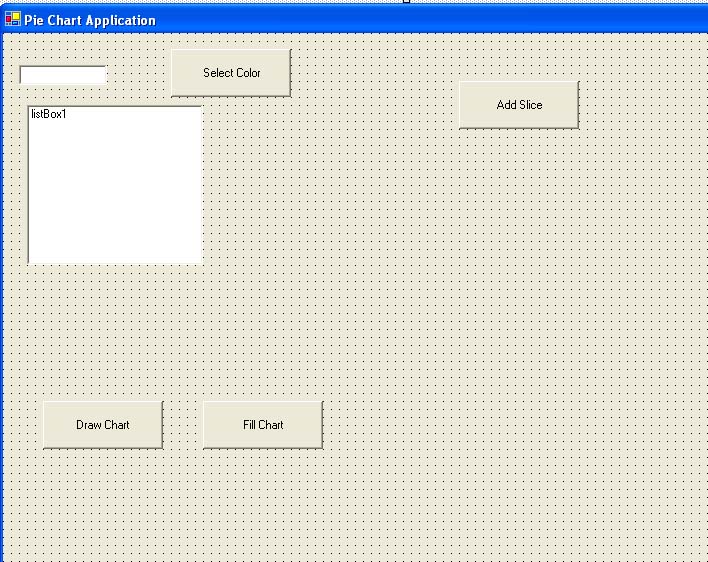
FIGURE 3.43: A pie chart-drawing application
First we create a Windows application and add four buttons, a text box, and a list box control. We change the text and name of the text box, and our final form looks like figure 3.43. In the Enter Share text box we will enter a number to represent the share of total items. For example, ass five values in the share box: 10, 20, 30, 40, and 50. The total is 150. The percentage of the share with value 10 is 10/150.
Listing 3.38 adds variable. You may notice the structure sliceData, which has two public variables: share and clr. The share variable represents the share of a slice, and clr is its color.
LISTING 3.38: The sliceData structure
//User-defined variables
private Rectangle rect = new Rectangle(250, 150, 200, 200);
public ArrayList sliceList = new ArrayList();
struct sliceData
{
public int share;
public Color clr;
};
private Color curClr = Color.Black;
int shareTotal = 0;
The Select Color button allows us to select the color for a share. As Listing 3.39 shows, we use ColorDialog to select a color.
Listing 3.39: Selecting a color
private void ColorBtn_Click(object sender, System.EventArgs e)
{
ColorDialog clrDlg = new ColorDialog();
if (clrDlg.ShowDialog() == DialogResult.OK)
{
curClr = clrDlg.Color;
}
}
The Add Slice button adds the data to an array to be added to the list for calculation. As Listing 3.40 shows, all data is added to an array. This code also adds the entered data to the ListBox control.
LISTING 3.40: Adding pie chart data
private void button1_Click (object sender, System.EventArgs e)
{
int slice = Convert.ToInt32 (textBox1.Text);
shareTotal +=slice;
sliceData dt;
dt.clr = curClr;
dt.share = slice;
sliceList.Add(dt);
listBox1.Items.Add(
"Share:" + slice.ToString()+" , " + curClr.ToString());
}
The Draw Chart and Fill Chart button clicks are used to draw the outer boundary and fill the chart, respectively. These buttons calls the DrawPieChart method with a Boolean variable, as shown in Listing 3.41.
LISTING 3.41: The Draw Pie and Fill Pie button click handlers
private void DrawPie_Click(object sender, System.EventArgs e)
{
DrawPiechart(false);
}
private void FillChart_Click(object sender, System.EventArgs e)
{
DrawPieChart(true);
}
The DrawPieChart method actually draws the pie chart, as shown in Listing 3.42. Depending on which button-Fill Chart or Draw Chart – was clicked, we call FillPie or DrawPie, respectively. We also read each sliceData variable of the array and calculate the percentage of a share in the entire chart, represented by an angle.
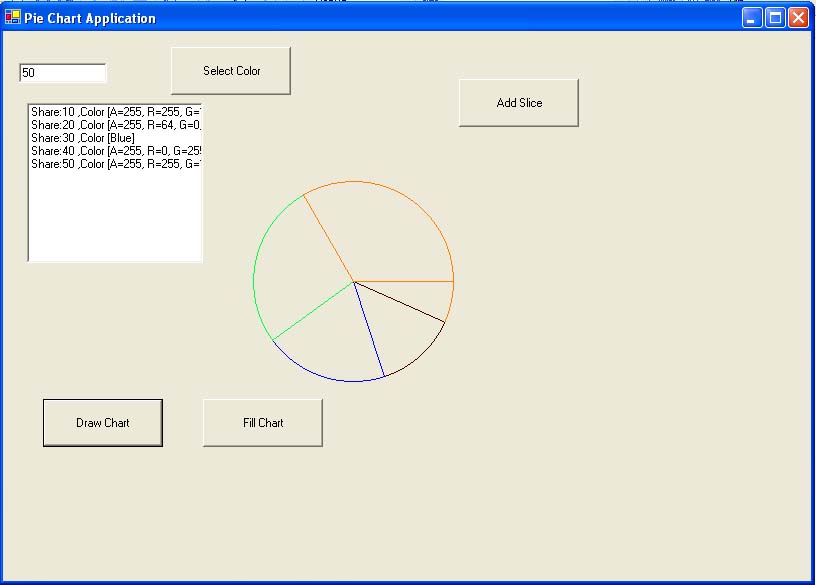
FIGURE 3.44: The Draw Chart button click in action
LISTING 3.42: The DrawPieChart method
private void DrawPieChart(bool flMode)
{
Graphics g = this.CreateGraphics();
g.Clear (this.BackColor);
Rectangle rect = new Rectangle (250, 150, 200, 200);
float angle = 0;
float sweep = 0;
foreach (sliceData dt in sliceList)
{
sweep = 360f * dt.share / shareTotal;
if(flMode)
g.FillPie(new SolidBrush(dt.clr), rect, angle, sweep);
else
g.DrawPie(new Pen(dt.clr), rect, angle, sweep);
angle += sweep;
}
g.Dispose();
}
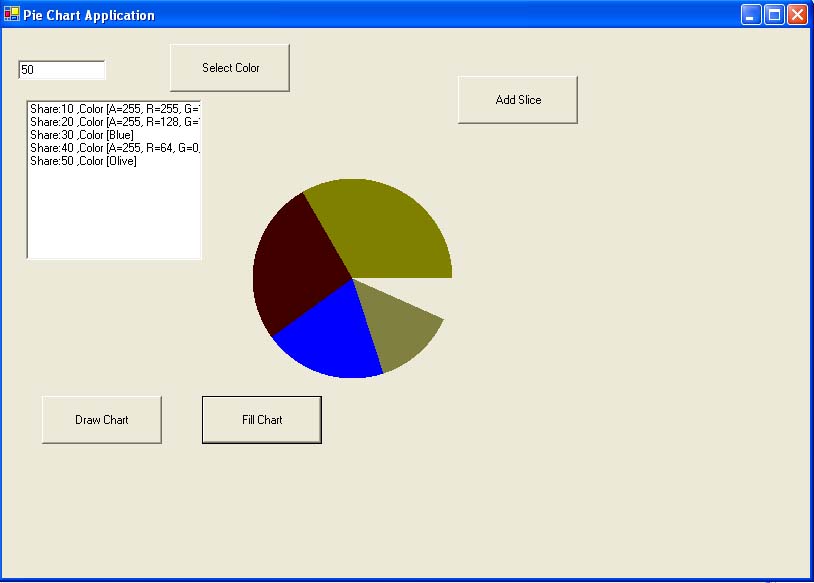
FIGURE 3.45: The Fill Chart button click in action
Let's see this application in action. We add shares 10,20,30,40 and 50 with different colors. The Draw Chart button click draws a pie chart, with the output shown in figure 3.44.
The Fill Chart button fills the chart, with the output shown in Figure 3.45.
Conclusion
Hope the article would have helped you in understanding the GDI+Painter Application. Read other articles on GDI+ on the website.
 |
This book teaches .NET developers how to work with GDI+ as they develop applications that include graphics, or that interact with monitors or printers. It begins by explaining the difference between GDI and GDI+, and covering the basic concepts of graphics programming in Windows. |