
Introduction
In this article, we will see how to bind data in Chart Bar series, using Web API2, AngularJS, and Entity Framework. In the following example, I want to display the population data, using AngularJS Chart plugin and Web API2.
Let’s go.
Prerequisites
As I said earlier, we are going to use jqxChart plugin in our MVC application. For this, you must have Visual Studio 2015 (.NET Framework 4.5.2) and SQL Server.
SQL Database part
Here, you will find the scripts to create the database and table.
Create Database
- USE [master]
- GO
- /****** Object: Database [PopulationDB] Script Date: 9/12/2016 8:54:39 AM ******/
- CREATE DATABASE [PopulationDB]
- CONTAINMENT = NONE
- ON PRIMARY
- ( NAME = N'PopulationDB', FILENAME = N'c:\Program Files (x86)\Microsoft SQL Server\MSSQL11.MSSQLSERVER\MSSQL\DATA\PopulationDB.mdf' , SIZE = 3072KB , MAXSIZE = UNLIMITED, FILEGROWTH = 1024KB )
- LOG ON
- ( NAME = N'PopulationDB_log', FILENAME = N'c:\Program Files (x86)\Microsoft SQL Server\MSSQL11.MSSQLSERVER\MSSQL\DATA\PopulationDB_log.ldf' , SIZE = 1024KB , MAXSIZE = 2048GB , FILEGROWTH = 10%)
- GO
- ALTER DATABASE [PopulationDB] SET COMPATIBILITY_LEVEL = 110
- GO
- IF (1 = FULLTEXTSERVICEPROPERTY('IsFullTextInstalled'))
- begin
- EXEC [PopulationDB].[dbo].[sp_fulltext_database] @action = 'enable'
- end
- GO
- ALTER DATABASE [PopulationDB] SET ANSI_NULL_DEFAULT OFF
- GO
- ALTER DATABASE [PopulationDB] SET ANSI_NULLS OFF
- GO
- ALTER DATABASE [PopulationDB] SET ANSI_PADDING OFF
- GO
- ALTER DATABASE [PopulationDB] SET ANSI_WARNINGS OFF
- GO
- ALTER DATABASE [PopulationDB] SET ARITHABORT OFF
- GO
- ALTER DATABASE [PopulationDB] SET AUTO_CLOSE OFF
- GO
- ALTER DATABASE [PopulationDB] SET AUTO_CREATE_STATISTICS ON
- GO
- ALTER DATABASE [PopulationDB] SET AUTO_SHRINK OFF
- GO
- ALTER DATABASE [PopulationDB] SET AUTO_UPDATE_STATISTICS ON
- GO
- ALTER DATABASE [PopulationDB] SET CURSOR_CLOSE_ON_COMMIT OFF
- GO
- ALTER DATABASE [PopulationDB] SET CURSOR_DEFAULT GLOBAL
- GO
- ALTER DATABASE [PopulationDB] SET CONCAT_NULL_YIELDS_NULL OFF
- GO
- ALTER DATABASE [PopulationDB] SET NUMERIC_ROUNDABORT OFF
- GO
- ALTER DATABASE [PopulationDB] SET QUOTED_IDENTIFIER OFF
- GO
- ALTER DATABASE [PopulationDB] SET RECURSIVE_TRIGGERS OFF
- GO
- ALTER DATABASE [PopulationDB] SET DISABLE_BROKER
- GO
- ALTER DATABASE [PopulationDB] SET AUTO_UPDATE_STATISTICS_ASYNC OFF
- GO
- ALTER DATABASE [PopulationDB] SET DATE_CORRELATION_OPTIMIZATION OFF
- GO
- ALTER DATABASE [PopulationDB] SET TRUSTWORTHY OFF
- GO
- ALTER DATABASE [PopulationDB] SET ALLOW_SNAPSHOT_ISOLATION OFF
- GO
- ALTER DATABASE [PopulationDB] SET PARAMETERIZATION SIMPLE
- GO
- ALTER DATABASE [PopulationDB] SET READ_COMMITTED_SNAPSHOT OFF
- GO
- ALTER DATABASE [PopulationDB] SET HONOR_BROKER_PRIORITY OFF
- GO
- ALTER DATABASE [PopulationDB] SET RECOVERY SIMPLE
- GO
- ALTER DATABASE [PopulationDB] SET MULTI_USER
- GO
- ALTER DATABASE [PopulationDB] SET PAGE_VERIFY CHECKSUM
- GO
- ALTER DATABASE [PopulationDB] SET DB_CHAINING OFF
- GO
- ALTER DATABASE [PopulationDB] SET FILESTREAM( NON_TRANSACTED_ACCESS = OFF )
- GO
- ALTER DATABASE [PopulationDB] SET TARGET_RECOVERY_TIME = 0 SECONDS
- GO
- ALTER DATABASE [PopulationDB] SET READ_WRITE
- GO
- USE [PopulationDB]
- GO
- /****** Object: Table [dbo].[tbt_Population] Script Date: 9/12/2016 7:08:26 AM ******/
- SET ANSI_NULLS ON
- GO
- SET QUOTED_IDENTIFIER ON
- GO
- SET ANSI_PADDING ON
- GO
- CREATE TABLE [dbo].[tbt_Population](
- [ID] [int] NOT NULL,
- [COUNTRY] [varchar](50) NULL,
- [POPULATION] [bigint] NULL,
- [PERCENT] [decimal](18, 0) NULL,
- CONSTRAINT [PK_tbt_Population] PRIMARY KEY CLUSTERED
- (
- [ID] ASC
- )WITH (PAD_INDEX = OFF, STATISTICS_NORECOMPUTE = OFF, IGNORE_DUP_KEY = OFF, ALLOW_ROW_LOCKS = ON, ALLOW_PAGE_LOCKS = ON) ON [PRIMARY]
- ) ON [PRIMARY]
- GO
- SET ANSI_PADDING OFF
- GO
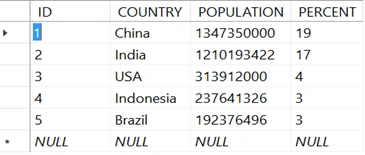
Create your MVC application
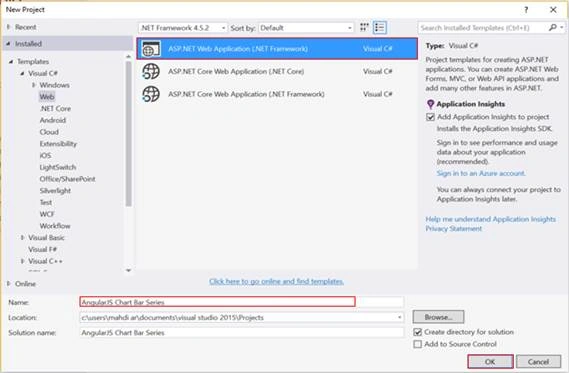
Now, open "Visual Studio" and select File >> New Project. A new window will pop up with the name New Project. Select ASP.NET Web Application (.NET Framework), name your project, and click OK.
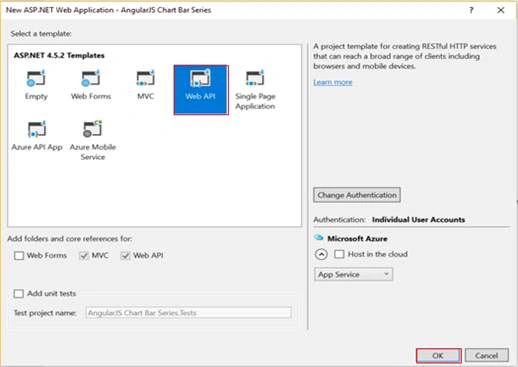
Next, select the Web API template in Template window, and click OK.
After creating the project, add ADO.NET Entity Data Model.
Adding ADO.NET Entity Data Model
First of all, right click on the project name and click Add >> Add New Item. A dialog box will pop up. Inside Visual C#, select Data >> ADO.NET Entity Data Model.
Now, enter name for your Dbcontext model as DbContextPopulation. Finally, click Add.
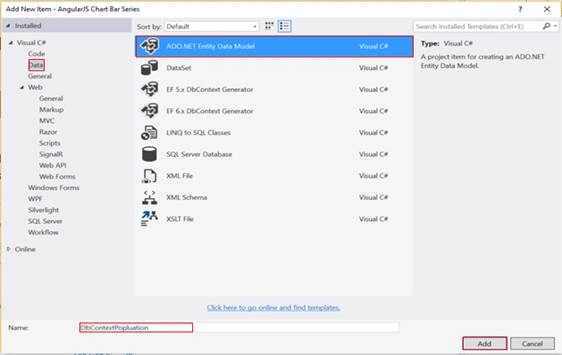
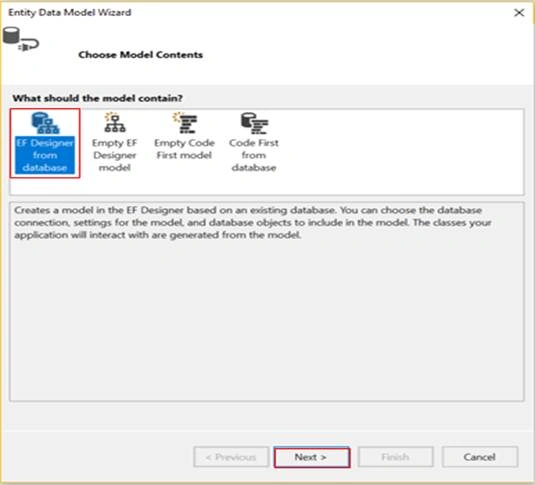
At this level, we are going to choose "EF Designer from database", as shown below.
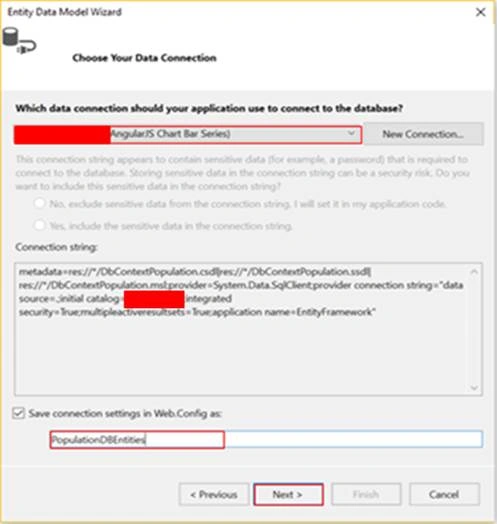
In the following snapshot, we need to choose the data connection which should be used to connect to the database. If the connection doesn’t exist, create a new connection by clicking on the "New Connection" button.
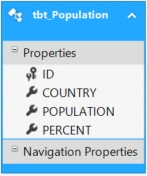
After clicking on Next, the Entity Data Model Wizard will pop up for choosing the object which we need to use. In our case, we are choosing tbt_Population table and click Finish. Finally, we see that EDMX model generates tbt_Population class.
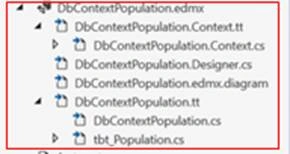
Make sure that DbContextPopulation.edmx file figures in Solution Explorer panel.
Create a Controller
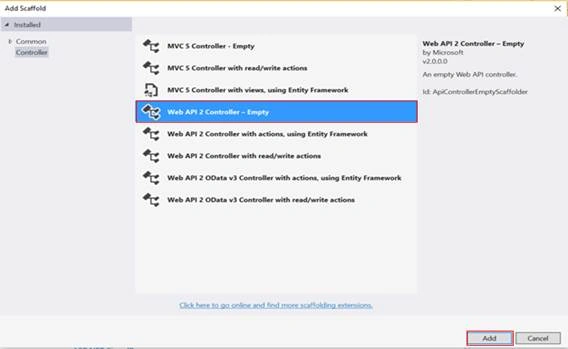
Now, create a Controller. Right click on the "Controllers" folder > Add > Controller> selecting Web API 2 Controller – Empty > click Add.
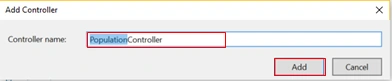
Enter Controller name (‘PopulationController’).
PopulationController.cs
- using System;
- using System.Collections.Generic;
- using System.Linq;
- using System.Net;
- using System.Net.Http;
- using System.Web.Http;
- namespace AngularJS_Chart_Bar_Series.Controllers
- {
- public class PopulationController : ApiController
- {
- //Dbcontext
- private PopulationDBEntities context = new PopulationDBEntities();
- //Get All Population
- [HttpGet]
- public IEnumerable<tbt_Population> GetPopulation()
- {
- var PopulationList = context.tbt_Population.ToList().OrderBy(x => x.COUNTRY);
- return PopulationList;
- }
- }
- }
Adding View
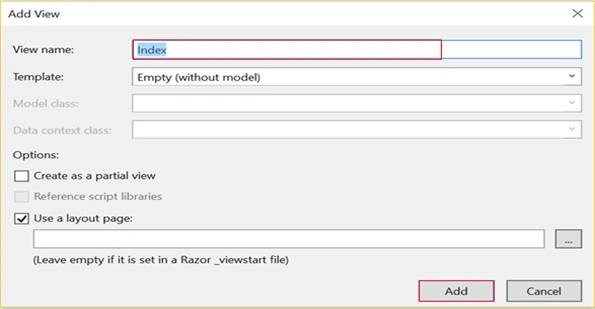
In Home Controller, right click on Index() action and select Add View. In the new pop-up, write a name for your View. Finally, click Add.
Note:
Don’t forget to download the following libraries from jqxwidgets.
- <!-- CSS -->
- <link href="~/Content/jqx.base.css" rel="stylesheet" />
- <!-- JS -->
- <script src="https://ajax.googleapis.com/ajax/libs/angularjs/1.4.7/angular.min.js"></script>
- <script src="~/Scripts/jqxcore.js"></script>
- <script src="~/Scripts/jqxangular.js"></script>
- <script src="~/Scripts/jqxdata.js"></script>
- <script src="~/Scripts/jqxdraw.js"></script>
- <script src="~/Scripts/jqxchart.core.js"></script>
- @{
- ViewBag.Title = "Index";
- }
- @section scripts{
- <!-- CSS -->
- <link href="~/Content/jqx.base.css" rel="stylesheet" />
- <!-- JS -->
- <script src="https://ajax.googleapis.com/ajax/libs/angularjs/1.4.7/angular.min.js"></script>
- <script src="~/Scripts/jqxcore.js"></script>
- <script src="~/Scripts/jqxangular.js"></script>
- <script src="~/Scripts/jqxdata.js"></script>
- <script src="~/Scripts/jqxdraw.js"></script>
- <script src="~/Scripts/jqxchart.core.js"></script>
- <script type="text/javascript">
- var myApp = angular.module('myApp', ["jqwidgets"]);
- myApp.controller('ChartCtrl', function ($scope) {
- //prepare chart data as an array
- var source = {
- datatype: 'json',
- datafields: [
- { name: 'COUNTRY' },
- { name: 'POPULATION' },
- { name: 'PERCENT' }
- ],
- url: 'api/Population/GetPopulation',
- };
- var dataAdapter = new $.jqx.dataAdapter(source);
- //prepare jqxchart Settings
- var settings = {
- title: "Top 5 most populated countries",
- description: "Statistics for 2011",
- showLegend: true,
- enableAnimations: true,
- padding: { left: 20, top: 5, right: 20, bottom: 5 },
- titlePadding: { left: 90, top: 0, right: 0, bottom: 10 },
- source: dataAdapter,
- xAxis:
- {
- dataField: 'COUNTRY',
- showGridLines: true,
- flip: false
- },
- colorScheme: 'scheme01',
- seriesGroups:
- [
- {
- type: 'column',
- orientation: 'horizontal',
- columnsGapPercent: 100,
- toolTipFormatSettings: { thousandsSeparator: ',' },
- valueAxis:
- {
- flip: true,
- unitInterval: 100000000,
- maxValue: 1500000000,
- displayValueAxis: true,
- description: '',
- formatFunction: function (value) {
- return parseInt(value / 1000000);
- }
- },
- series: [
- { dataField: 'POPULATION', displayText: 'Population (millions)' }
- ]
- }
- ]
- };
- $scope.chartSettings = settings;
- });
- </script>
- }
- <h2>AngularJS Chart Bar Series Example</h2>
- <div ng-app="myApp" ng-controller="ChartCtrl">
- <jqx-chart id='chartContainer' jqx-settings="chartSettings" style="width: 850px; height: 500px"></jqx-chart>
- </div>
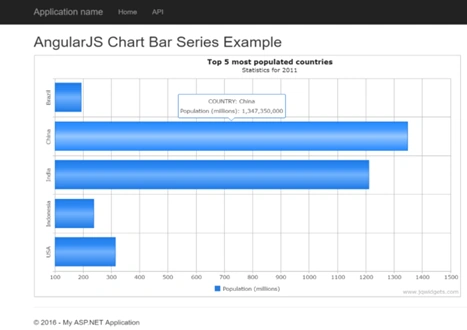
That's it. Please share your feedback and queries in the Comments section.
Nikhil SanganiPosted Sep 16, 2016, 12:04 AM
Nice one.