

Code coverage is a White Box testing methodology that requires knowledge of and access to the code itself rather than simply using the interface provided. Code coverage is probably most useful during the module testing phase, though it also has benefit during integration testing and probably at other times, depending on how and what you are testing.
Regression tests are usually Black Box tests and as such may be unsuitable for use with code coverage. But often, especially in the Perl world, module, integration, regression and any other tests you might perform all use the same test code, just at different times.
Parasoft dotTEST can manage unit tests and application hosted tests:
- Unit tests are low-level tests designed to validate application units, such as methods or classes.
- Application Hosted Tests are higher-level tests that help you test the integration of the application. dotTEST allows you to explore and execute tests, report and inspect results, interactively or non-interactively generate unit tests and minimize test maintenance effort. It uses the industry-standard NUnit Framework as the framework for implementing unit tests.
- It uses industry-standard NUnit Framework for generating and running tests. dotTEST also can run Microsoft Unit Tests.
There are two main ways to create unit tests with dotTEST
Unit Test Genie: Allows you to generate specific object factory methods and test scenarios by interacting with dotTEST wizards. You can control precisely what objects and test scenarios are generated.
Non-Interactive Test Case Generation: Allows you to create a large number of tests with minimal time and effort. This is especially useful for achieving high code coverage and establishing a regression baseline.
dotTEST allows you to explore and execute tests, report and inspect results as in the following image as get from report server ( Concerto Server ), interactively or non-interactively generate unit tests and minimize tests maintenance effort. It uses industry-standard NUnit Framework for generating and running tests and this also supports Microsoft Unit Tests.
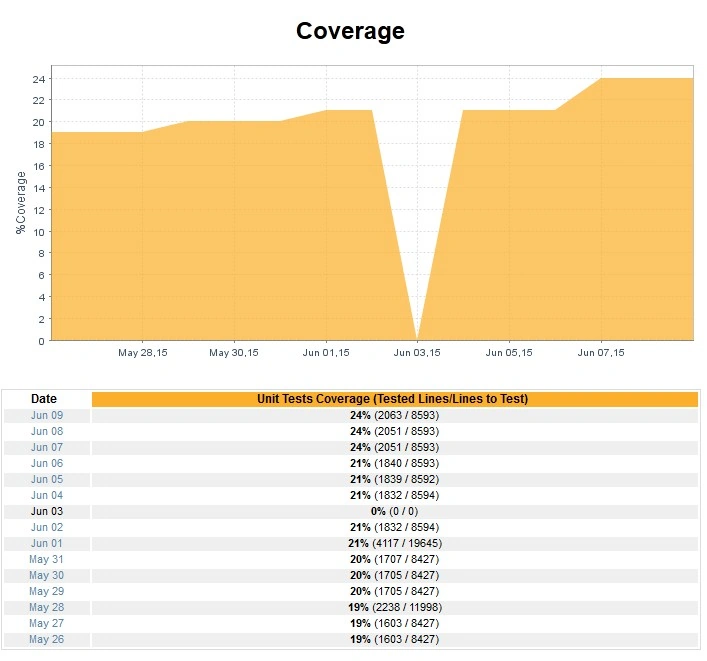
Figure 1: Coverage
Procedure to install Parasoft dotTest and configure it.
- Install the dotTest. It will automatically integrate with VS2008, VS2010 or VS2012.
- Setup the source control settings as shown below (ensure the path to the relevant EXE of source control currently supports 11 source controls VSS, Team Foundation Server, SVN, GIT and so on).
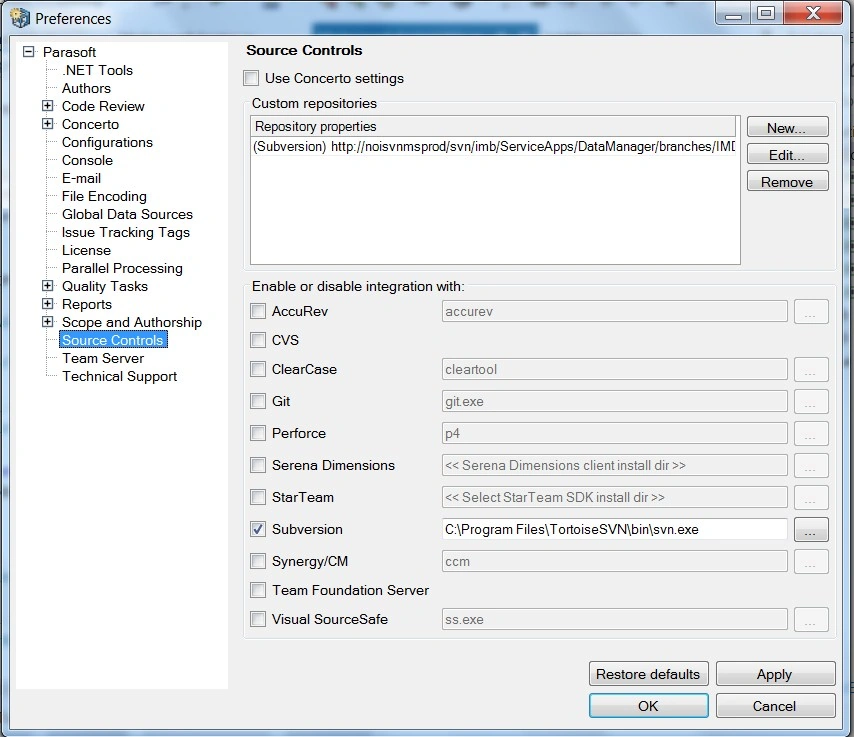
Figure 2: Source Control
The dotTest is configured now to be used.
How to set up code coverage
Set up Code Coverage using the tools to configure your Unit Testing runs to also look for coverage.
Open the Test Configuration you're using to do Unit Testing by going to “Parasoft” on the toolbar “Test Configurations” <Test Configuration>.
Click on the “Execution” tab of the Test Configuration and then click on the “Coverage” sub- tab. Enable the “Calculate source coverage” option.
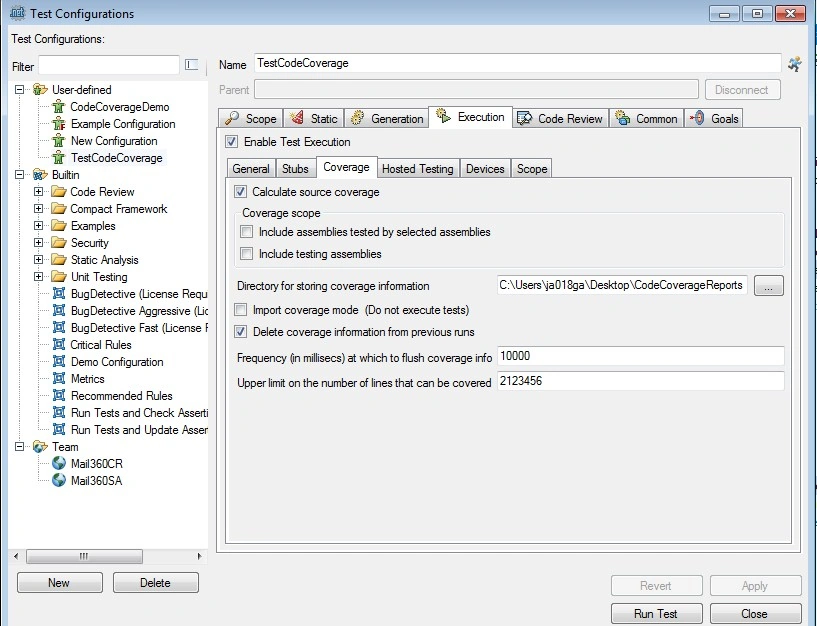
Figure 3: Test Configuration
Configure the options within this “Coverage” page to your specifications.
Note that if you do not set the “Directory for storing coverage information” option that it will save the coverage information in “Local Settings\Application Data\xtest\Dottest\Coverage”.
Analyzing Coverage in the GUI
To view coverage information after dotTEST has executed tests or imported coverage, do one of the following.
Open an editor for the tested file. A green bar in the left margin indicates that the related line was covered.
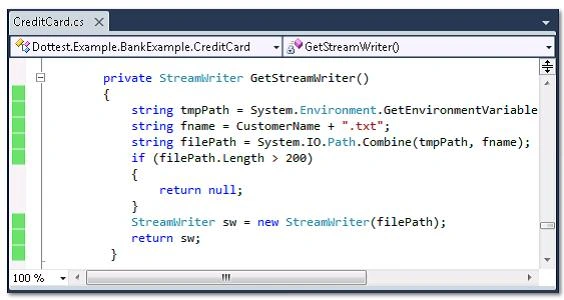
Figure 4: Analyzing Coverage
Open the Coverage view by choosing Parasoft> Show View> Coverage. The Coverage view shows coverage statistics (coverage percentage, total executable lines and lines covered) for the tested code and for each method.
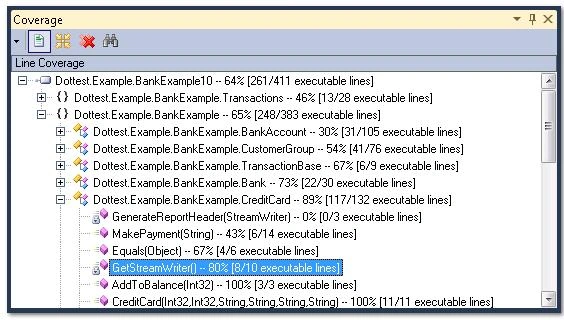
Figure 5: Coverage View
Note: Capturing code coverage is only available with the Language-based tools (for example C\C++Test for C and C++ projects, Jtest for Java Projects, dotTEST for .NET applications). Also, you will need to perform Unit Testing for coverage information to be collected.
Parasoft published Report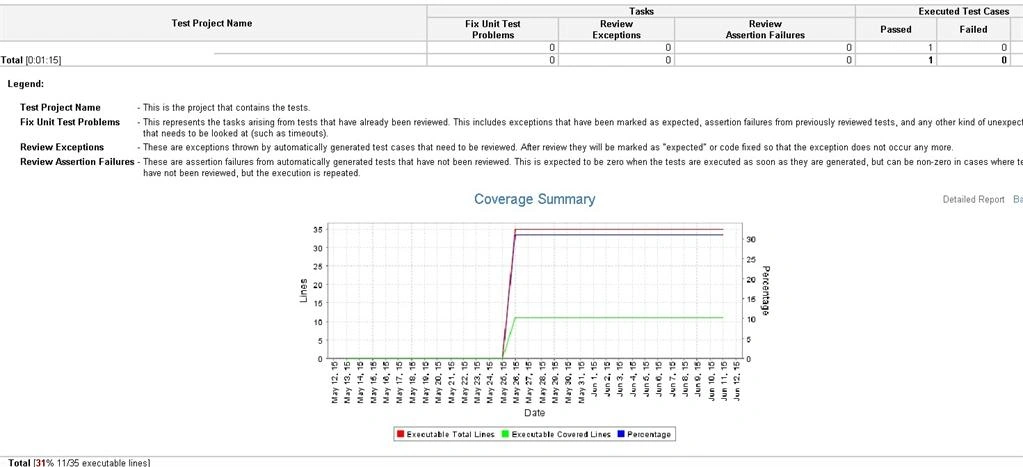
Figure 6: Parasoft Published Report
Testing from the Command Line Interface (dottestcli) from Jenkins, TeamCity, Team Foundation Server or other Continous Integration Servers with daily build process
The following is a sample CLI Command to run the code coverage:
dottestcli.exe -config "team:// Run Tests and Check Assertions – Config settings as defined on top" -solution ..\..\..\apps\SolutionPath -solutionConfig "Release" -resource "Project Path" -resource "UnitTest Project path" -localsettings "Configuration Setting file path" -report “Report Path” -publish
CLI Usage
The general procedure for testing from the command line is as follows.
Use the dottestcli utility, with appropriate options, to launch analysis in the command-line mode.
Key options are:
- Solution: Specifies the location of the solution file to use.
- Config: Specifies Test Configuration.
- Resource: Specifies project(s)/file(s) to be tested.
- Publish: Publishes test results to Team Server.
Testing from the Command Line Interface (dottestcli)
- Report: Generates a report.
- Localsettings: Passes advanced settings for Team Server/Parasoft Report Center/ mail reporting.
- Visual Studio: Visual Studio version (such as 2005, 2008, 2010). If the dotTEST installation is not on your path, launch dottestcli with the full path to the executable.
- SolutionConfig: Name of solution configuration, for example, Debug or Release. If omitted, then the active configuration is used.
- TargetPlatform: Name of target platform, for example: "Any CPU" or x86. If omitted, then the active configuration is used.
Conclusion and Check Points
- Before running the code coverage all the projects should be built correctly.
- Please check the settings in Parasoft's Preferences (in any Visual Studio version such as 2005, 2008, 2010 ur 2012).
- Web site projects are different than most other Visual Studio projects. Their solution files and project files (in other words .sln and .csproj files) are either non-existent or are created in a location that is not easily accessible. The files in a web site get processed automatically when you open the web site in the browser.
- Consequently, it is difficult to write unit tests for website projects since the project with unit tests cannot easily reference the assembly that contains the classes. It is also difficult to run Code Coverage analysis on such projects.
- Parasoft dotTEST supports unit testing of website projects. Because dotTEST creates all the necessary assemblies and adds the appropriate references to the test project, it enables you to write unit tests for web site projects. Parasoft dotTEST can analyze projects that are hosted in the file system or at an HTTP server.
NitinPosted Jun 15, 2015, 9:34 AM
good one
Rahul Kumar SaxenaPosted Jun 15, 2015, 2:33 AM
Good Show...
Santhakumar MunuswamyPosted Jun 12, 2015, 2:26 PM
keep it up...
Santhakumar MunuswamyPosted Jun 12, 2015, 2:26 PM
Thanks for nice article :)
Sibeesh VenuPosted Jun 12, 2015, 2:21 AM
Good One.