

Introduction
This article is all about how to use your data from various resources and generate ng2-charts using Angular 10. In this article, I am using simple data and ng2-charts for creating charts.
Prerequisites
- We should have a basic knowledge of Angular 2 and above.
- Visual Studio Code can be installed
Implementation
We have different open sources to create charts in Angular 2 and above. Here I am going to use ng2-charts. These charts having a very simple configuration and adopted for all the screens.
Installation
- Create a new angular project using the below command
ng new angchar - install bootstrap using the below command
npm install --save bootstrap - Install ng2-charts using npm
npm install --save ng2-charts - You need to install and include the Chart.js library in your application (it is a peer dependency of this library) (more info can be found in the official chart.js
Install Chart.js library
npm install --save chart.js
Now open the newly created angular application .then double click app.module.ts and type below line of codes
- import { BrowserModule } from'@angular/platform-browser';
- import { NgModule} from'@angular/core';
- import { HttpClientModule } from'@angular/common/http';
- import { AppComponent } from'./app.component';
- import { ChartsModule } from'ng2-charts';
- @NgModule({
- declarations: [
- AppComponent,
- MychartComponent
- ],
- imports: [
- BrowserModule, HttpClientModule, ChartsModule
- ],
- providers: [],
- bootstrap: [AppComponent]
- })
- exportclassAppModule {}
Now create one new component for the chart to implementation by type the below command in terminal
ng g c Mychart
Once new chart component is created include in the app.module.js
- import { MychartComponent } from'./mychart/mychart.component';
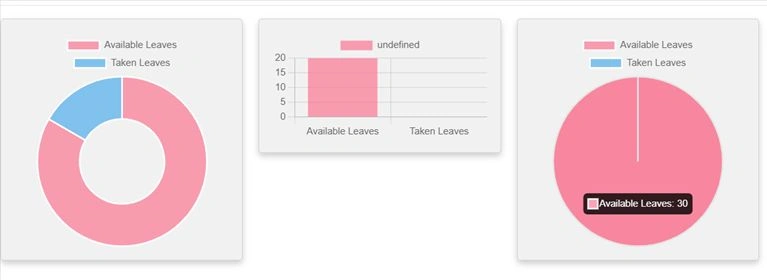
Here I am going to use Pie ,bar &doughnut chart for demo. So open mychart.component.html, paste the below lines of code. I will explain each line.
- <hr>
- <divclass="row">
- <divclass="column">
- <divclass="card">
- <divclass="box">
- <divid="chart-container">
- <canvasbaseChart[chartType]="chartType_a"[data]="chartData_a"[labels]="chartLabels_a"
- [options]="chartOptions_a">
- </canvas>
- </div>
- </div>
- </div>
- </div>
- <divclass="column">
- <divclass="card">
- <divclass="box">
- <divid="chart-container">
- <canvasbaseChart[chartType]="chartType_b"[data]="chartData_b"[labels]="chartLabels_b"
- [options]="chartOptions_b">
- </canvas>
- </div>
- </div>
- </div>
- </div>
- <divclass="column">
- <divclass="card">
- <divclass="box">
- <divid="chart-container">
- <canvasbaseChart[chartType]="chartType_c"[data]="chartData_c"[labels]="chartLabels_c"
- [options]="chartOptions_c">
- </canvas>
- </div>
- </div>
- </div>
- </div>
- </div>
Here the below line of code is mainly creating the chart.
- <canvasbaseChart[chartType]="chartType_a"[data]="chartData_a"[labels]="chartLabels_a"
- [options]="chartOptions_a">
- </canvas>
In mychartcomponent.ts file – write the below line of codes
- import {
- Component,
- OnInit
- } from '@angular/core';
- import 'chart.piecelabel.js';
- @Component({
- selector: 'app-mychart',
- templateUrl: './mychart.component.html',
- styleUrls: ['./mychart.component.css']
- })
- exportclassMychartComponentimplementsOnInit {
- public data: any;
- public chartType_a: string = 'doughnut';
- public chartLabels_a: Array < string > ;
- public chartData_a: Array < number > ;
- public chartOptions_a: any;
- public chartType_b: string = 'bar';
- public chartLabels_b: Array < string > ;
- public chartData_b: Array < number > ;
- public chartOptions_b: any;
- public chartType_c: string = 'pie';
- public chartLabels_c: Array < string > ;
- public chartData_c: Array < number > ;
- public chartOptions_c: any;
- constructor() {
- this.data = {
- "ITAB_LEAVE": [{}, {}, {}],
- "ITAB_LEAVE1": [{
- "anzhl": "50",
- "rverb": "10"
- }],
- "ITAB_LEAVE2": [{
- "anzhl": "20"
- }],
- "ITAB_LEAVE3": [{
- "anzhl": "30"
- }]
- }
- this.chartData_a = [this.data.ITAB_LEAVE1[0].anzhl, this.data.ITAB_LEAVE1[0].rverb];
- this.chartLabels_a = ["Available Leaves", "Taken Leaves"];
- this.chartOptions_a = {
- pieceLabel: {
- render: 'label',
- position: 'outside'
- }
- }
- this.chartData_b = [this.data.ITAB_LEAVE2[0].anzhl, this.data.ITAB_LEAVE2[0].rverb];
- this.chartLabels_b = ["Available Leaves", "Taken Leaves"];
- this.chartOptions_b = {
- pieceLabel: {
- render: 'label',
- position: 'outside'
- }
- }
- this.chartData_c = [this.data.ITAB_LEAVE3[0].anzhl, this.data.ITAB_LEAVE3[0].rverb];
- this.chartLabels_c = ["Available Leaves", "Taken Leaves"];
- this.chartOptions_c = {
- pieceLabel: {
- render: 'label',
- position: 'outside'
- }
- }
- }
- ngOnInit(): void {}
- }
[chartType]="chartType_a" - type of chart pie, bar
[data]="chartData_a" - data which we are binding
[labels]="chartLabels_a" - we can customize the label using this. For this please use:
- import'chart.piecelabel.js';
Now to add more UI I have added below css changes in mychart.component.css
- *{
- box - sizing: border - box;
- }
- body {
- font - family: Arial, Helvetica, sans - serif;
- }
- /* Float four columns side by side */
- .column {
- float: left;
- width: 25 % ;
- padding: 010 px;
- }
- /* Remove extra left and right margins, due to padding */
- .row {
- margin: 0 - 5 px;
- }
- /* Clear floats after the columns */
- .row: after {
- content: "";
- display: table;
- clear: both;
- }
- /* Responsive columns */
- @mediascreen and(max - width: 600 px) {
- .column {
- width: 100 % ;
- display: block;
- margin - bottom: 20 px;
- }
- }
- /* Style the counter cards */
- .card {
- box - shadow: 04 px8px0rgba(0, 0, 0, 0.2);
- padding: 16 px;
- text - align: center;
- background - color: #f1f1f1;
- }
Now run ng serve to see the output
Summary
In this article, we learned about ng2-charts.js in an Angular application to create Charts.
Join the conversation! Your thoughts help the community grow.