

Introduction
A Mini Chart is the way to represent a bar chart and trend chart in a cell of metrics. It is very useful because in one column the Mini Chart shows the current value and another cell shows the historical trends of that value.
Creation of Mini Chart in QlikView Application.
Use the following procedure to create a sample of a Mini Chart.
Step 1: Open the QlikView application
In the first step you need to open the QlikView application then go to File-> New then this window will be opened.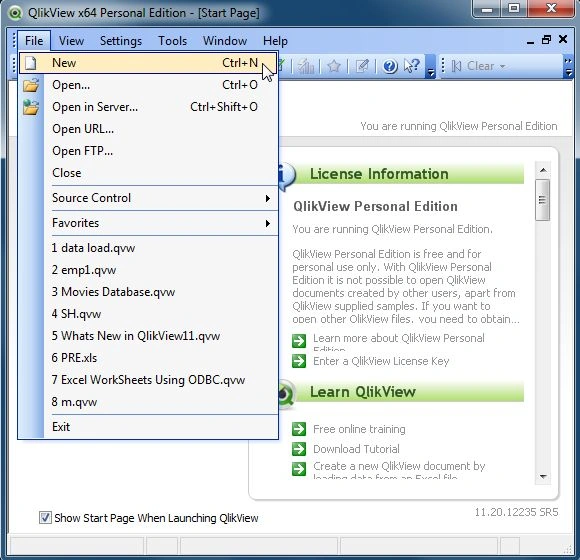
Step 2: Open Edit Script
The second step is open the edit script window from:
File-> Edit Script.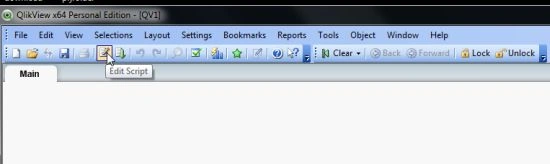
- Then this window will be opened.
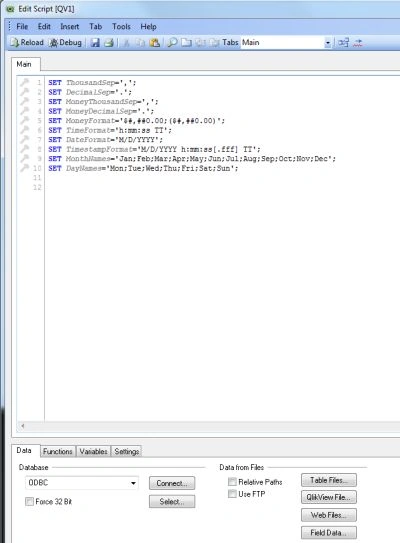
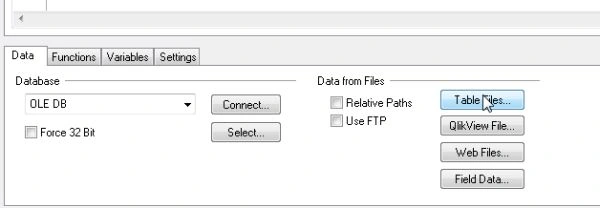
In this step we open our Excel file and click on the Open button.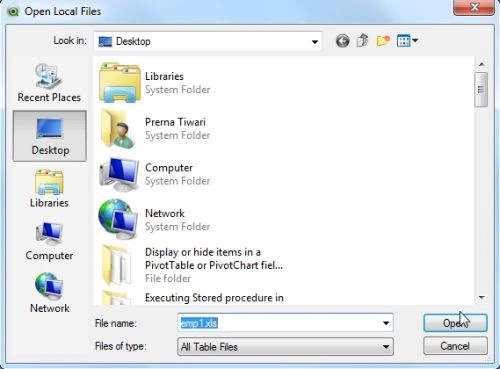
Step 4: File wizard window
Then this window will be opened. Now here you can see your Excel file will be opened that you import in the table files and click on the Finish button.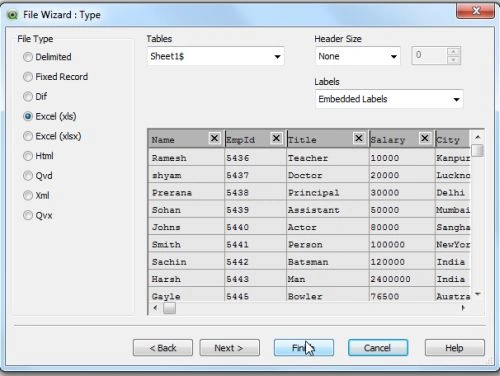
Step 5: Code of edit script
Now, in the edit script the Excel file upload was successful and reload it.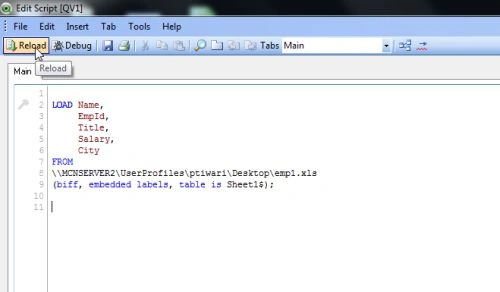
Step 6: Save file
The next step is we need to save our QlikView file.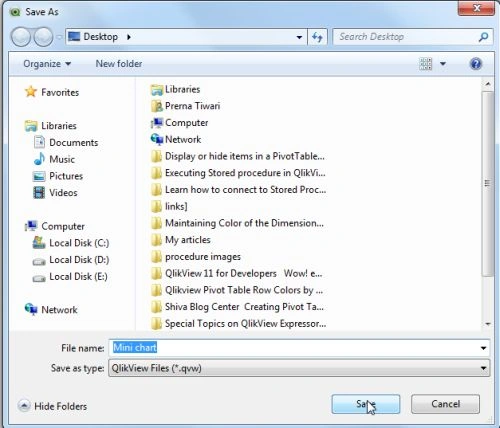
Step 7: Sheet property window
The sheet property window will be opened. In this window you add fields that you want to display as a table and click on the OK button.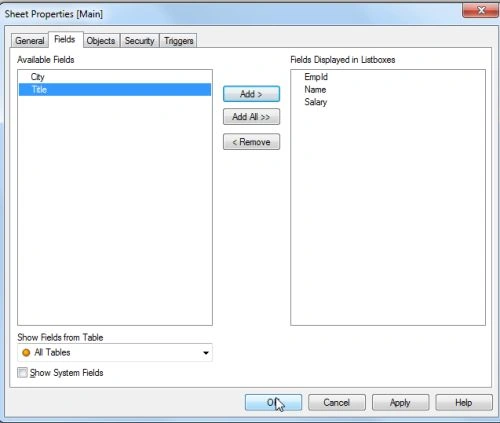
Then you will see this window.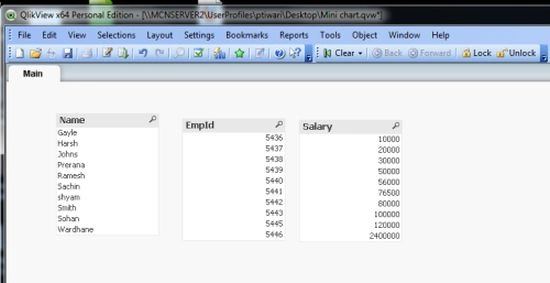
Step 8: Select a chart
Right-click anywhere in the main window and select chart.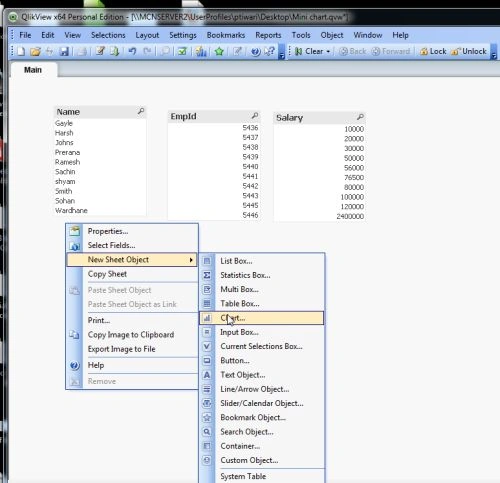
Step 9: Next the General window will be opened and select chart and click on the Next button.
Step 10: Add Dimension
The next step is to add fields and click on the Next button.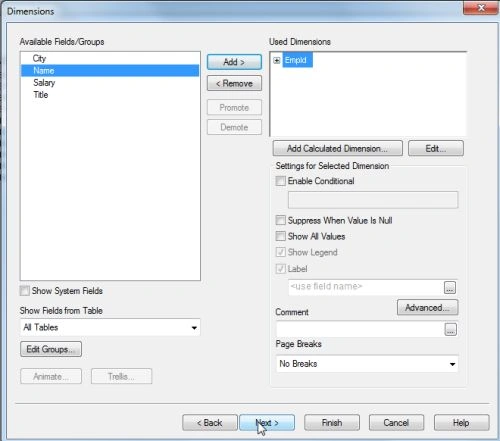
Step 11: Edit expression window
When you click on the next button then the edit expression window will be opened. Here you define the function then click on the OK button.
Suppose I want to define a sum of empids then I use empid.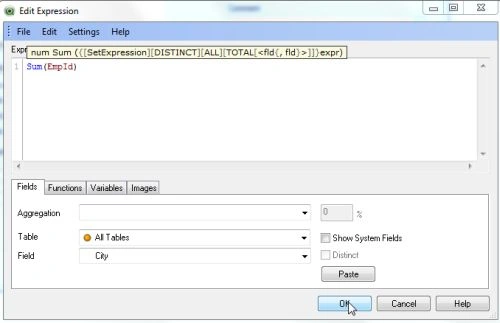
Step 12: Select Mini Chart
When we click on the OK button then the expression window will be opened. Here we select Mini Chart from the Representation tab and click on the Mini Chart settings.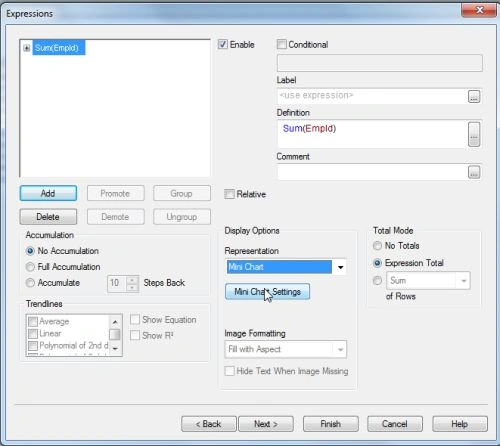
Step 13: Mini Chart settings
Here we can set the Mini Chart settings according to our own choice and click on the OK button.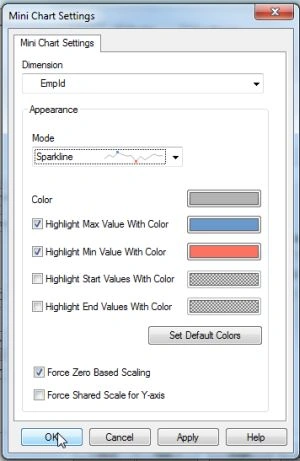
Then click on the Finish button.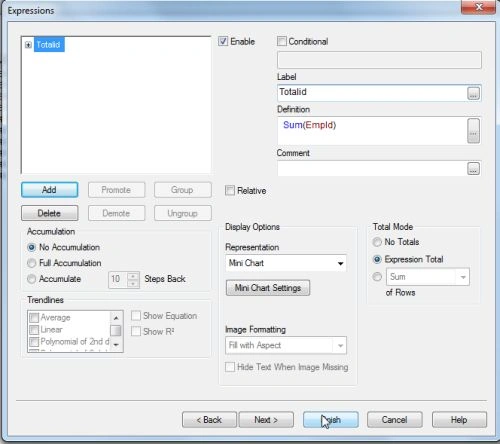
Now here you can see the sum of empids because in the edit expression I used the sum function.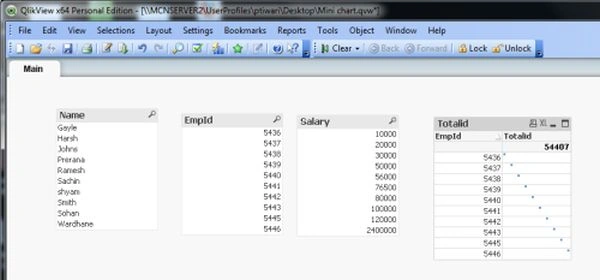
Step 14: Add another Mini Chart
If you want to add another Mini Chart then go to the properties of the Mini Chart.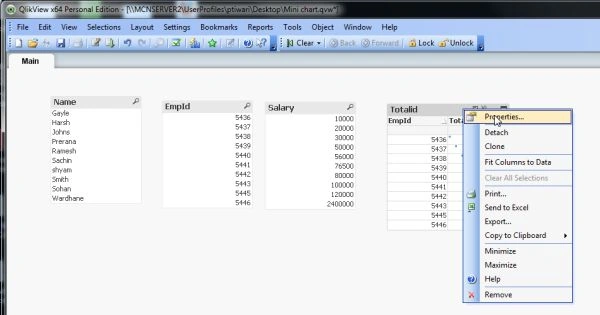
Step 15: Now click on the Add button, then the Edit Expression window opens. Then you define another function and click on the OK button.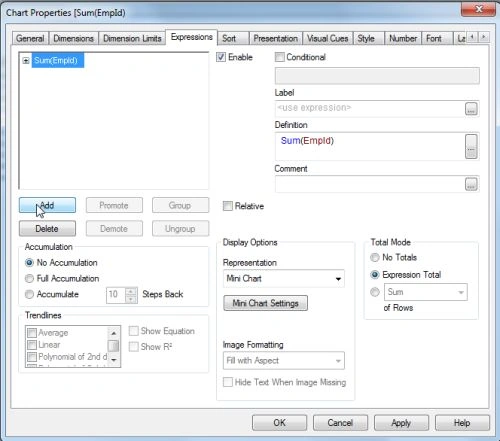
Suppose here I want to define the sum of salaries then I use salary.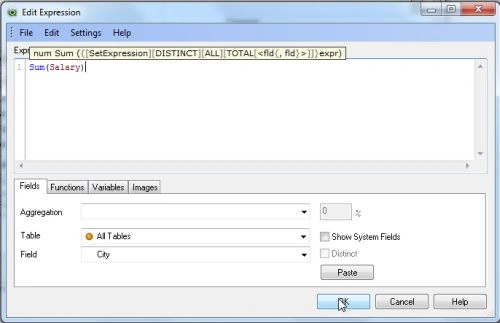
Then select Mini Chart and click on the Mini Chart settings button.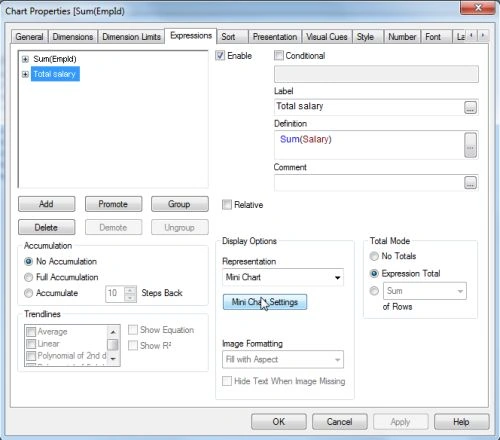
Step 16: Mini Chart settings
Here we can set Mini Chart settings according to own choice and click on the OK button.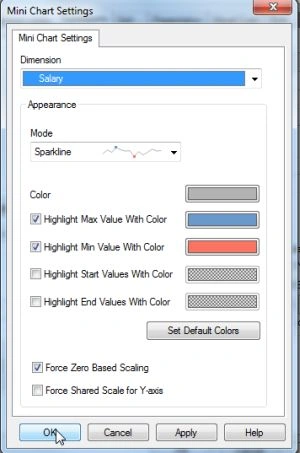
Then click on the OK button.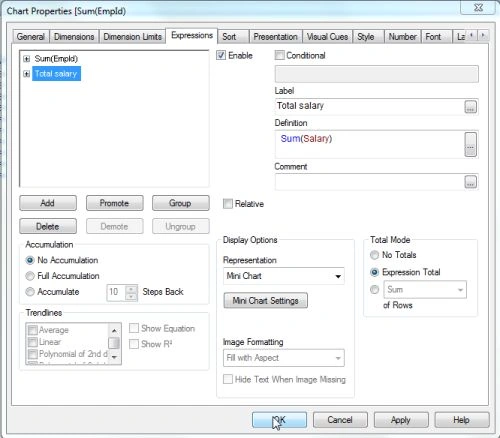
Now here you can see the sum of the salaries because in the edit expression I used the sum function.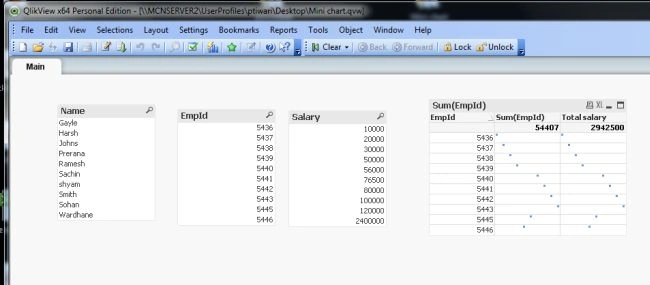
Summary
This article described how to create a Mini Chart in a QlikView application.
Prerana TiwariPosted May 8, 2014, 11:07 PM
Thanku Gopi Chand
Gopi ChandPosted May 8, 2014, 9:30 AM
You write such a good article...