

Introduction
The cross table is also known as a 2-way table. This table consists of both columns and rows. It can be used to display the subtotals for columns.
The following is the procedure for using a cross table in QlikView.
Step 1: Open the QlikView application, then go to:
"File" -> "New"
Then the following window will be opened: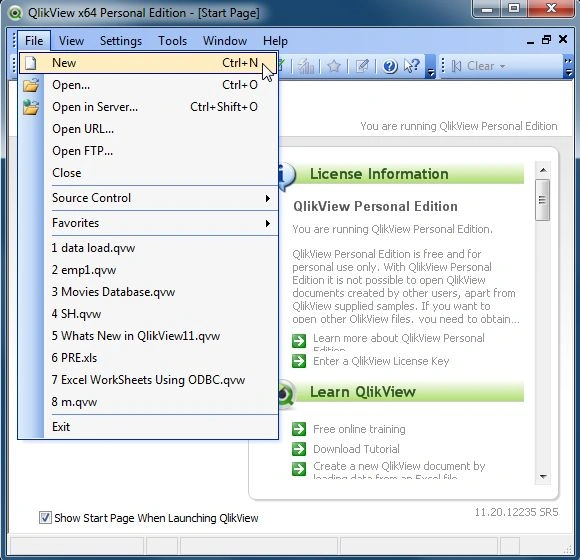
Step 2: Select a data source from my Excel file.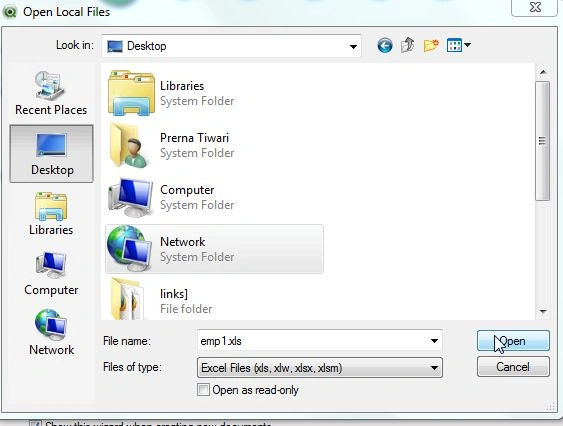
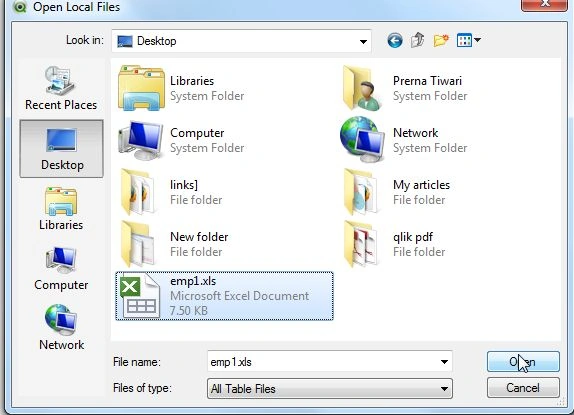
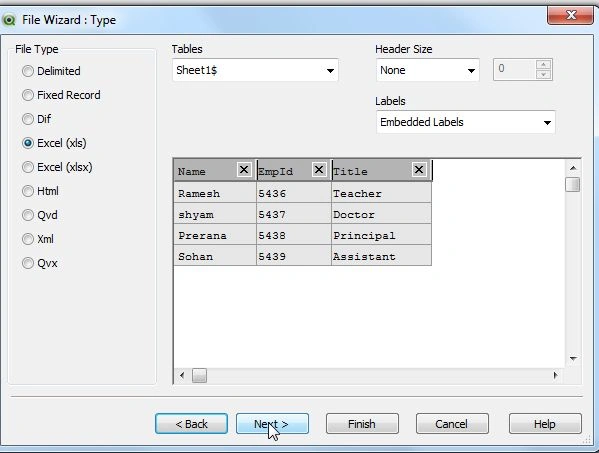
Step 3: Then we need to browse to our Excel file and open the our Excel file, then this window will be opened.
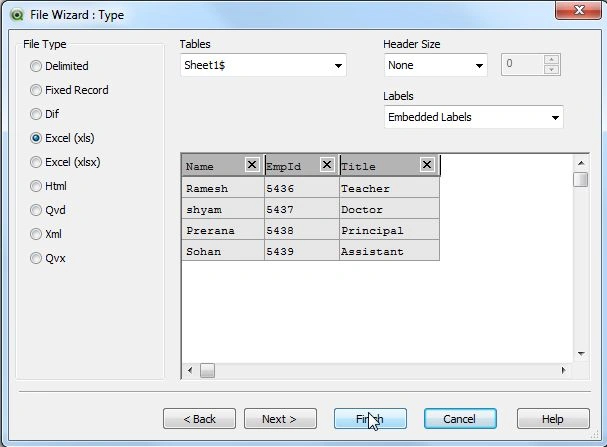
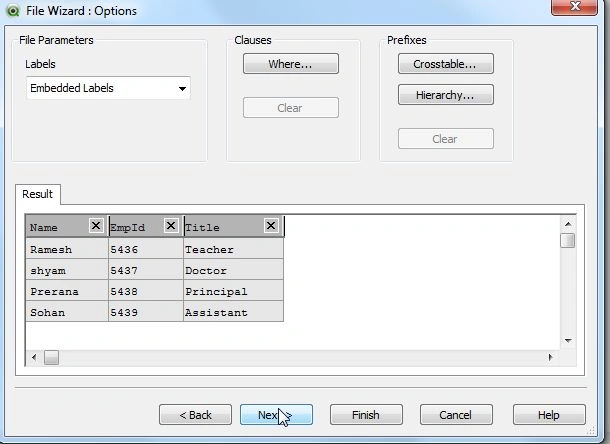
Step 4: After browsing to our file, we need to verify the data.
Step 5: After verifying the data, double-click on the "Next" button; we need to save our QlikView file.
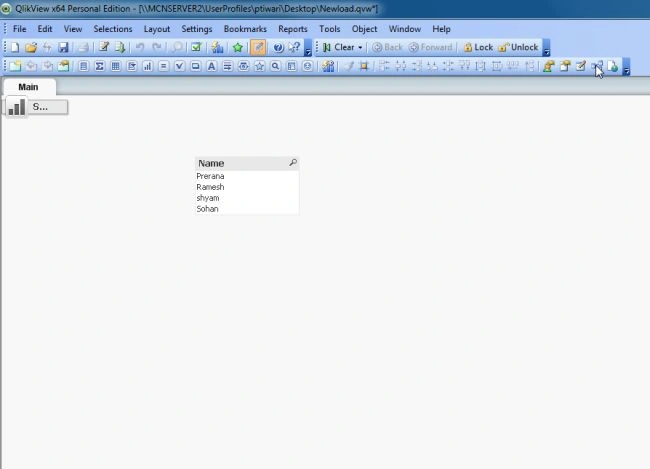
Step 6: After saving the QlikView file, we need to select the chart type. The chart shows the representation of the data.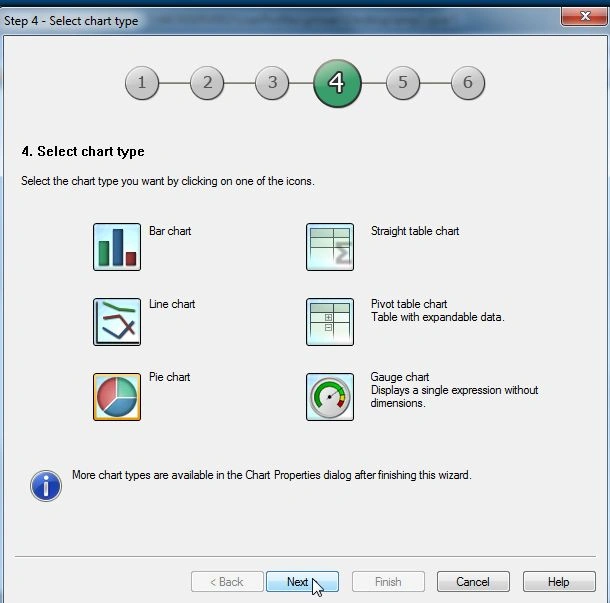
Step 7: The next step is to define the data dimensions and objects. The dimension shows the grouping of calculated data.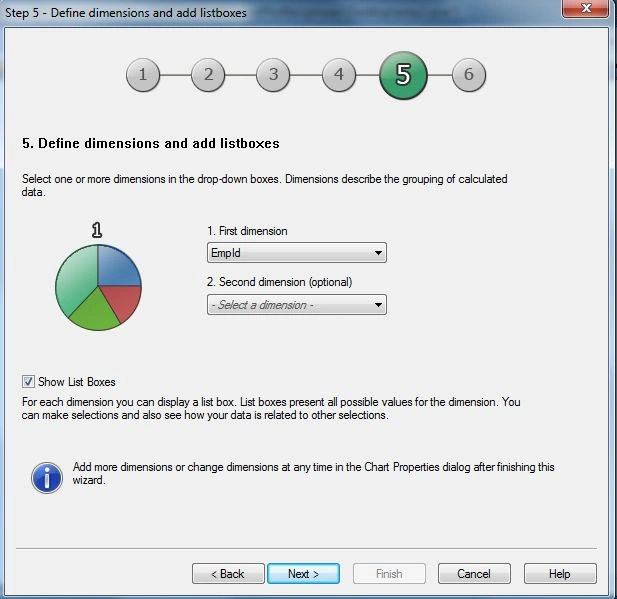
Step 8: The next step is to add an expression. This is an important step because the expression defines the calculated values in the chart.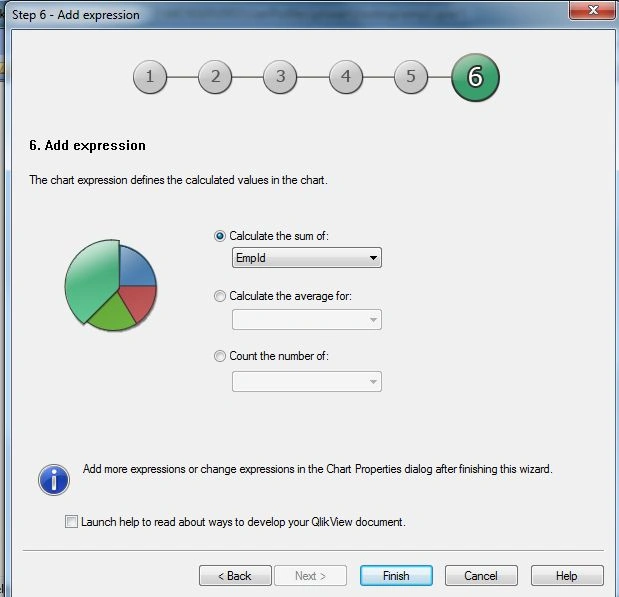





Lakshmanan Sethu SankaranarayanPosted Apr 6, 2014, 5:11 AM
Simple to follow!