

Introduction
Data Analytics is one of the hottest topics of the 21st Century. The process of Data Analytics requires us to get data, clean it, transform it, then generate insights, patterns, or models for machine learning. All this through an automated mechanism. To perform data analytics we need data. This data should be in large amounts. The more it is, the more we can drill down to generate desired outcomes.
Few words about the Excel App. Excel is one of the data champions. It has been around even before data analytics became popular. It is an advanced mathematical tool with a lot of capabilities. It can still get a lot of things done that are part of business use cases for data analysis. We should explore it more, but not go out of context in this tutorial. Excel is great in the context of Microsoft Business Intelligence Tools. It cannot be replaced for the capabilities it provides.
Nowadays, many advanced data handling tools are available in the market. They are designed with the intent of making development easy and contain complete Tool Sets for getting things done from development to deployment. They support modern development Practices and much more. We are going to Discuss SSIS and Power BI.
SQL Server Integration Services (SSIS)
SSIS is a platform offered by Microsoft, it is used for building enterprise data integration and transformation solutions. It can extract data from various sources such as Excel, CSV, Databases, MPP Databases such as Hadoop, etc. It has a wide variety of connectors. It is an ETL Tool. It is used to create data workflows. It can automate many tasks. It can automate SQL Server Maintenance Tasks. It is widely used by companies that rely on Microsoft Technology Stack. It has a lot of built-in capabilities. It offers us a drag and drop interface for Workflow Development. It helps us easily work with databases so we can write SQL Queries or invoke Stored Procedures. It also provides us capabilities to Write C#/VB.NET code as part of the workflow.
Power BI
Power BI is a Business Analytics Tool, it is used to visualize data and can also perform data transformations. It is a Self-Service Analytics. It can connect with multiple sources. It can be extended with the Power Apps ecosystem which includes Power Automate, Power Virtual Agents. Also, with Office 365 Integration. We can publish reports and we can interact with Power BI API to change data. Power BI itself contains a lot of capabilities and can handle all data-related operations.
To perform advanced data analytics and automation there are many popular tools, some examples of ETL and Visualization Tools include:
|
Visualization
|
ETL
|
|
Tableau
|
Alteryx*
|
|
QlikSense
|
Talend
|
|
PowerBI
|
Informatica*
|
|
SSIS
|
|
|
Matillion
|
|
|
Data Visualization Capabilities
|
What will be covered in this tutorial?
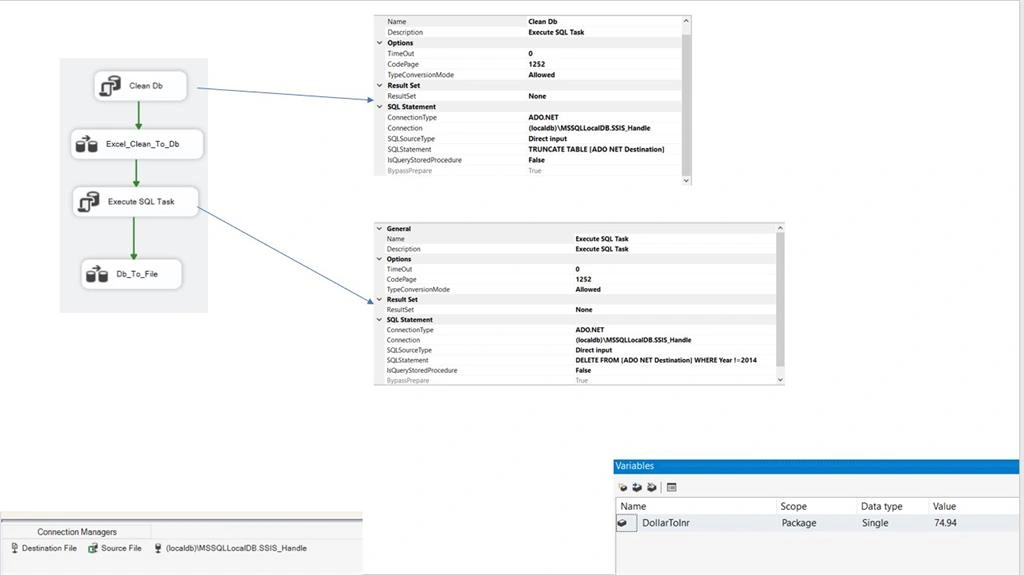
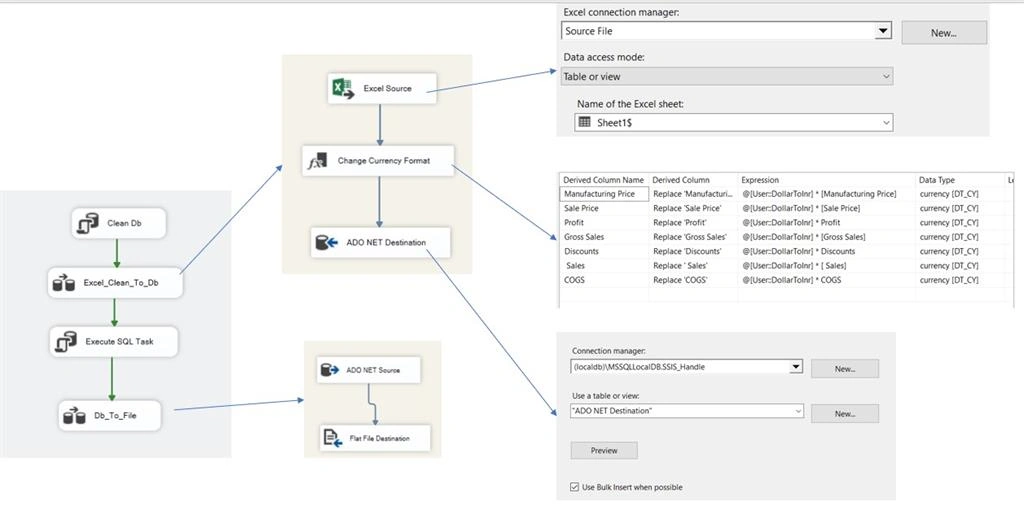
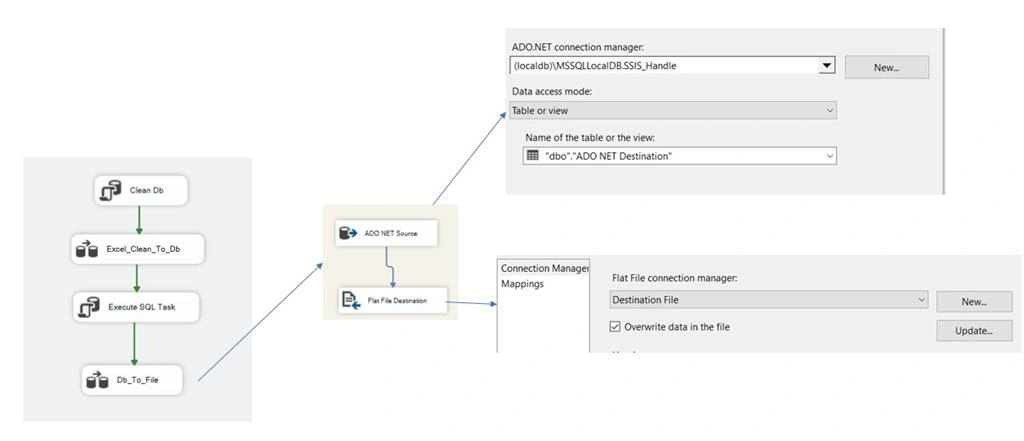
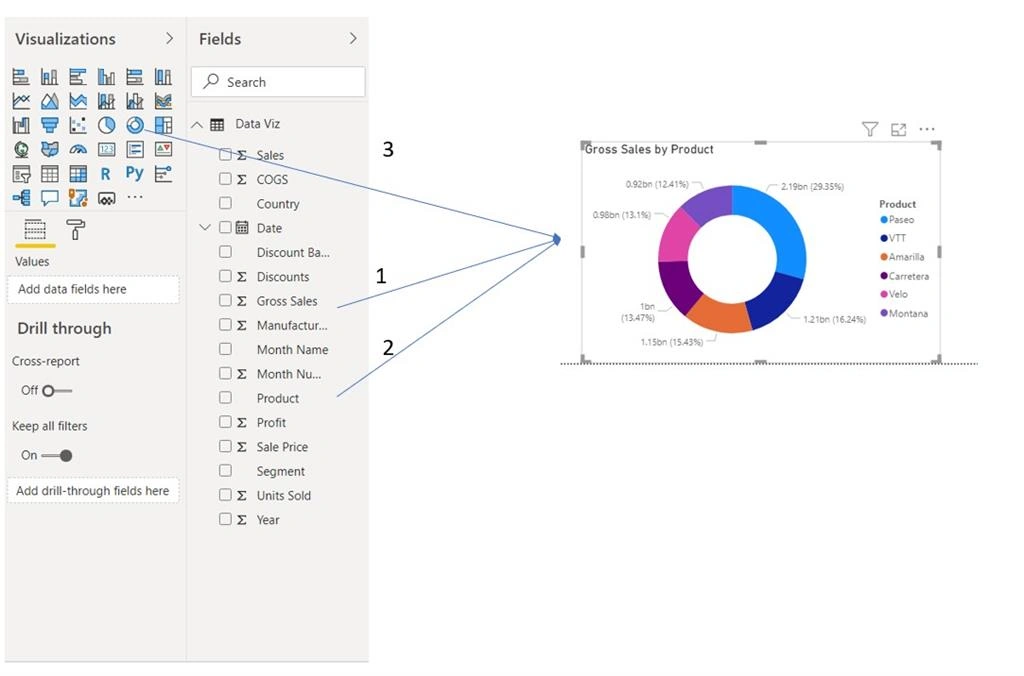
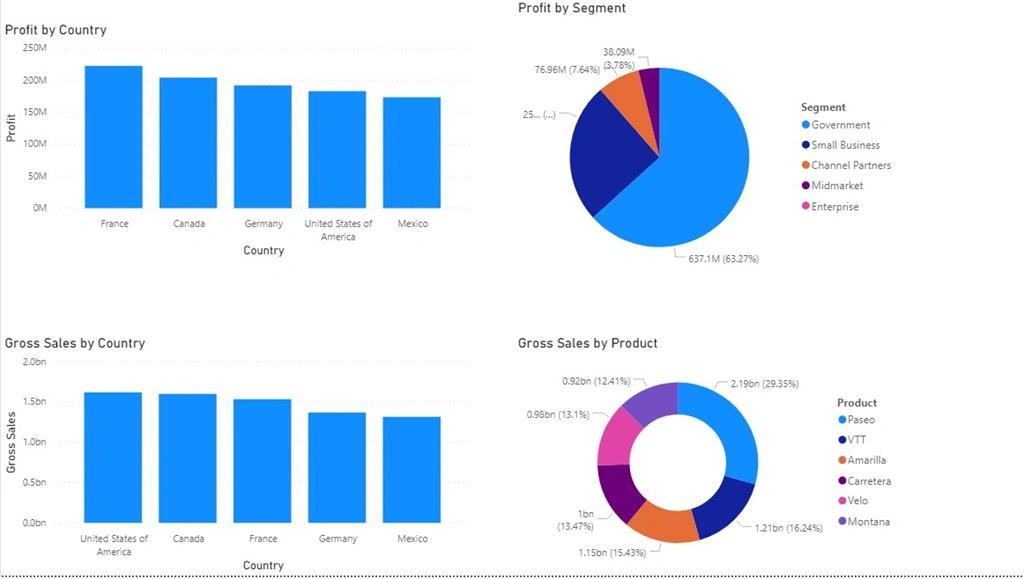
In this tutorial, we are going to implement full end-to-end flow for Data Analytics. We will clean (if required), transform, and then visualize the dataset. To make this possible we are going to use Microsoft Technology Stack, this will require us to use SQL Server Integration Services(SSIS) and Power BI. The purpose is to demonstrate the capabilities of both and not to show the most efficient solution. This is just an introduction use case. We will use the financial sample dataset.
Prerequisites
-
SSIS
-
Microsoft Power BI
Data Set
https://docs.microsoft.com/en-us/power-bi/create-reports/sample-financial-download
To-Do List
Hui WangPosted Apr 10, 2021, 7:52 PM
I think Just PowerBi can all the jobs you mentioned. Right?
Roshan RathodPosted Aug 4, 2020, 12:05 AM
Good one..keep it up