

Funnel Charts
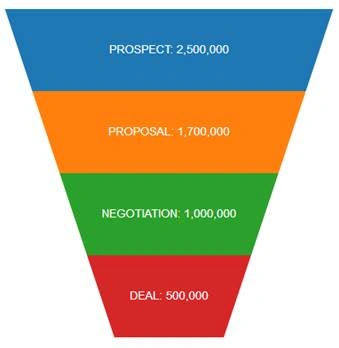
Fig 1: Funnel Chart showing sales stages.
- Create index.html and copy-paste below code,
- <!DOCTYPE html>
- <html lang="en">
- <head>
- <title>Funnel Chart Sample</title>
- <meta charset="utf-8">
- <meta name="viewport" content="width=device-width, initial-scale=1">
- <link rel="stylesheet" href="http://maxcdn.bootstrapcdn.com/bootstrap/3.3.5/css/bootstrap.min.css">
- <script src="https://ajax.googleapis.com/ajax/libs/jquery/1.11.3/jquery.min.js"></script>
- <script src="http://maxcdn.bootstrapcdn.com/bootstrap/3.3.5/js/bootstrap.min.js"></script>
- </head>
- <body>
- <div class="container">
- <div class="page-header">
- <h2>
- Funnel Chart</h2>
- </div>
- <div class="row">
- <div class="col-lg-6">
- <div class="panel panel-default">
- <div class="panel-heading">
- <span class="glyphicon glyphicon-equalizer"></span>Sales Funnel
- </div>
- <div class="panel-body">
- <div id="funnel"></div>
- </div>
- </div>
- </div>
- </div>
- <script src="https://cdnjs.cloudflare.com/ajax/libs/d3/3.5.16/d3.min.js"></script>
- <script src="d3-funnel.min.js" type="text/javascript"></script>
- <script src="app.js" type="text/javascript"></script>
- </body>
- </html>
In the above code base, you will notice references for D3.min.js and d3-funnel.min.jsAs a standard, I am displaying my chart in a bootstrap panel.To generate funnel chart, following ‘id’ is important from our index.html,<div id="funnel"></div> - Behind this index.html, we have an implementation in our app.js.Refer our app.js as below,
- $(document).ready(function()
- {
- showfunnel();
- });
- function showfunnel()
- {
- var data =
- [
- ['PROSPECT', 2500000],
- ['PROPOSAL', 1700000],
- ['NEGOTIATION', 1000000],
- ['DEAL', 500000]
- ];
- var options =
- {
- chart:
- {
- curve:
- {
- enabled: true
- }
- }
- };
- var chart = new D3Funnel('#funnel');
- chart.draw(data, options);
- }
In the above code base, you will notice function showfunnel() actually is rendering chart using array data[].Options- provide various options to render charts. Currently, I am using a funnel to be displayed in curve. So used {chart: {curve:{enabled:true}}}. - Open index.html in a browser and see how the funnel is displayed
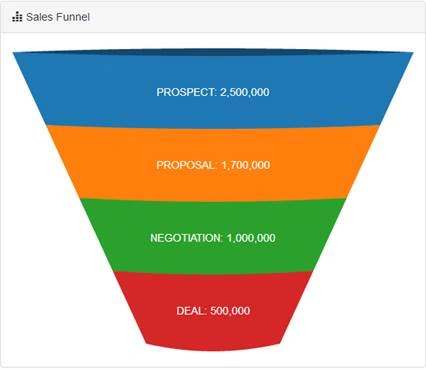 Fig 2: Curved Funnel Chart showing sales stages.
Chart Options
Now we will try changing some chart options,Go back to app.js and at options, use the below line to render chart with bottom section pinched a little bit. And refresh index.html.- var options = {chart: {bottomPinch:1}};
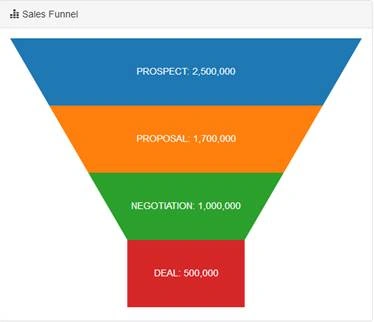 Fig 3: Pinched Funnel Chart.If you want to display funnel section height based on data then use the below options. After rendering the chart, observe height for each section and their values are in proportion.
- var options = {block: {dynamicHeight: true}};
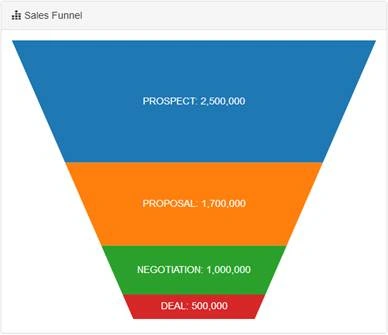 Fig 4: Funnel Chart with dynamic height based on values.
Summary
So stakeholders can now visualize opportunities or proposal data and with such a funnel decide where to focus. And also they can judge their pipelines.
Santhakumar MunuswamyPosted Jun 25, 2016, 3:10 AM
Nice share
Vignesh ManiPosted Jun 14, 2016, 12:14 PM
Nice one