

In this article, we are going to see how business users can utilize the tabular model for data analysis and visualization in Excel.
This article depends on Part I. So, it would be great if you first go through this:
We will see how we can create SSAS tabular model and setup measure, roles, calculated columns, hierarchies in tabular modeling.Now, we created a Tabular Model and deployed it on the analysis server. Let’s open Excel.
- Go to Data Tab, click on Get Data Option from a ribbon.
- Go to From Database, Analysis services.
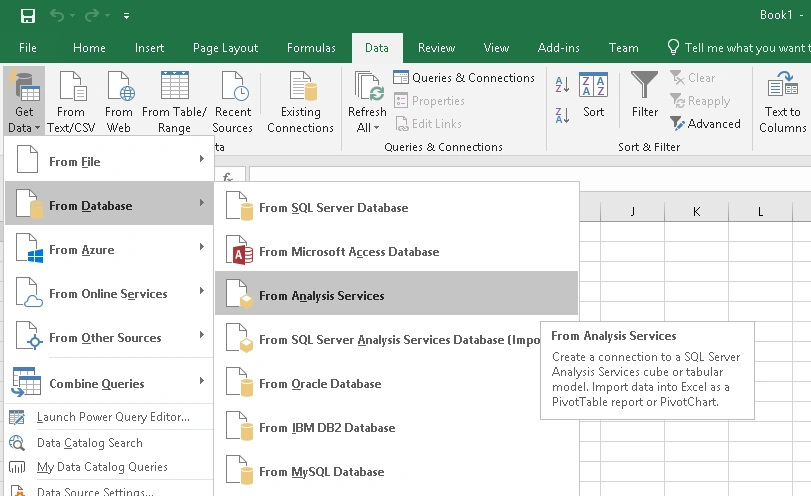
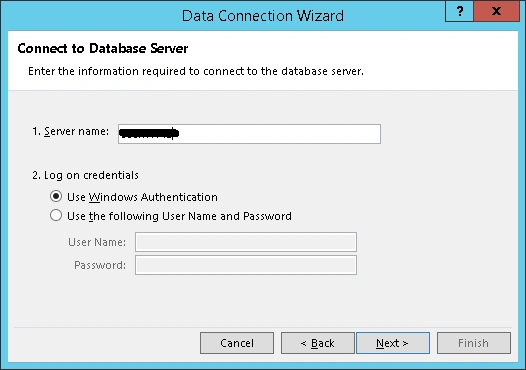
- It will open Data connection wizard, enter server & credential details. Click on next.
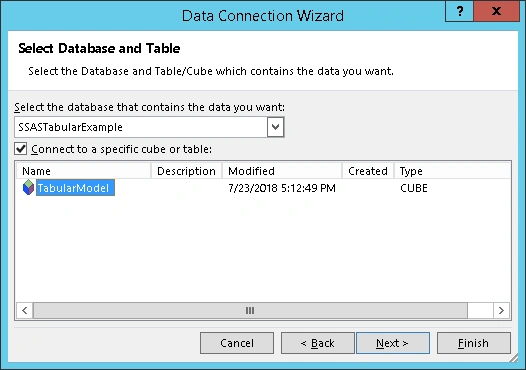
- Select Tabular Model Database. Click on next.
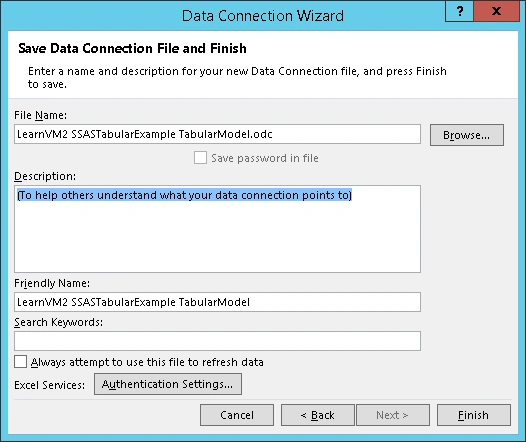
- Now, Save Data Connection and Click on finish.
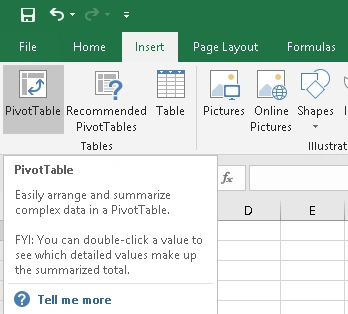
- Go to Insert Tab, Click on Pivot Table option from the ribbon.
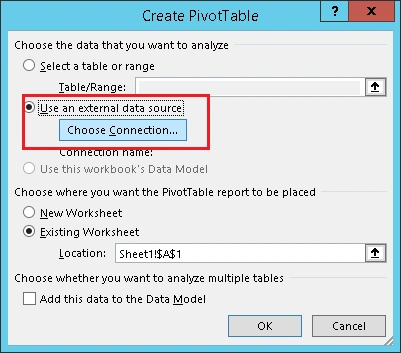
- Select External Data Source. Click on choose connection.
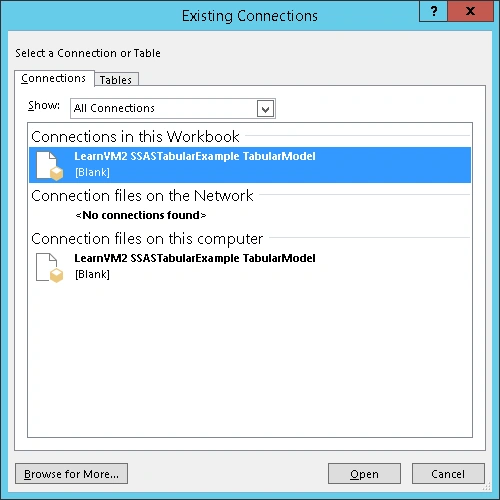
- We can see our saved data connection there. Select and click on open button.
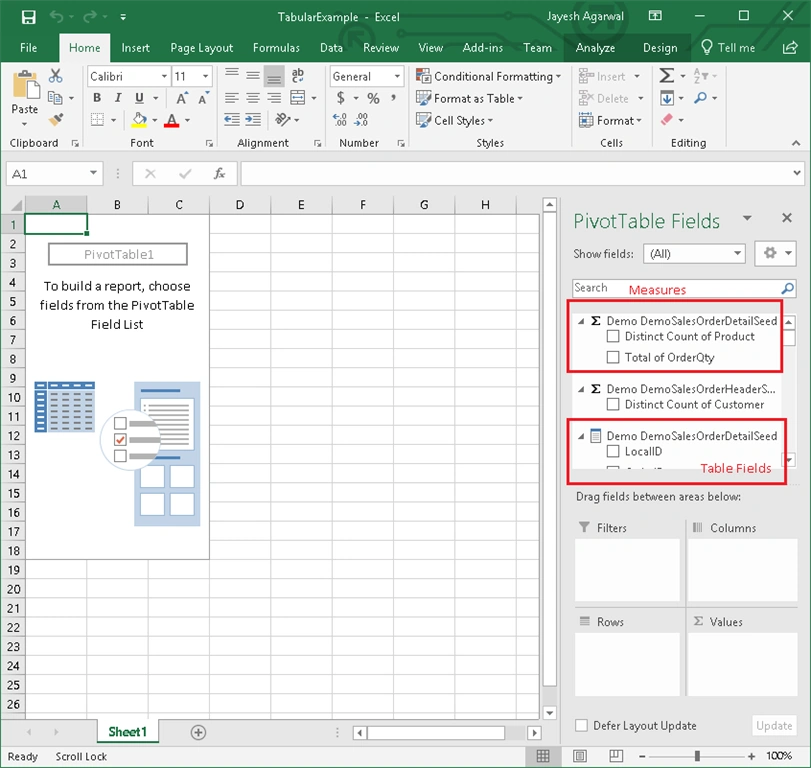
- Now, we can see PivotTable Fields on the right corner of Excel. All measures, hierarchies, table field will be there that we have created in Part-I Tabular Model as shown in the below screenshot,
Use Cases
Data is ready. Let’s take a use case;
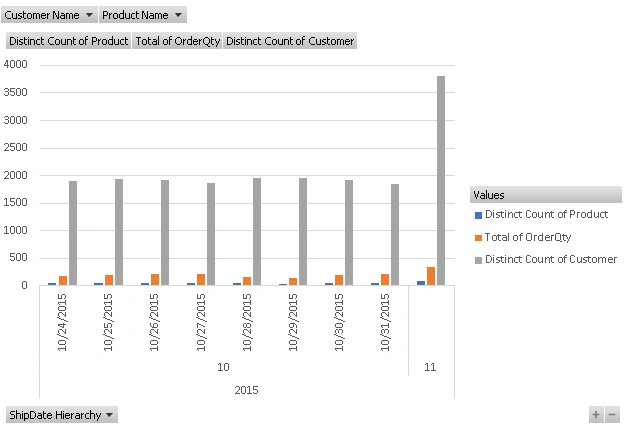
We want to filter the data by product name and show product count, customer count, the sum of order quantity by Year, Month, and Date in Excel.
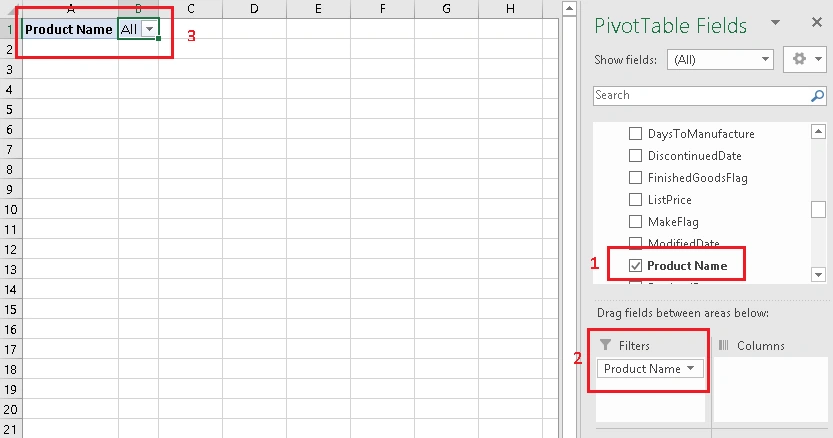
- Go to PivotTable Fields, scroll down select Product Name from Product table and drag to Filters section.
- It will add Product Name Filter in Excel worksheet.
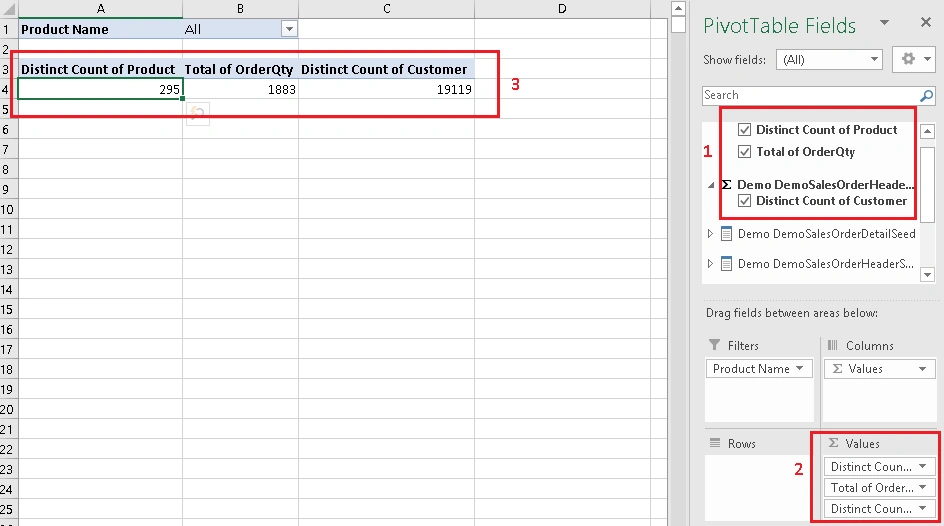
- Scroll up in PivotTable Fields, select Distinct Count of Product, Total of Order Quantity, Count of Custom from measures and drag to values section.
- We can see that it will add in a worksheet.
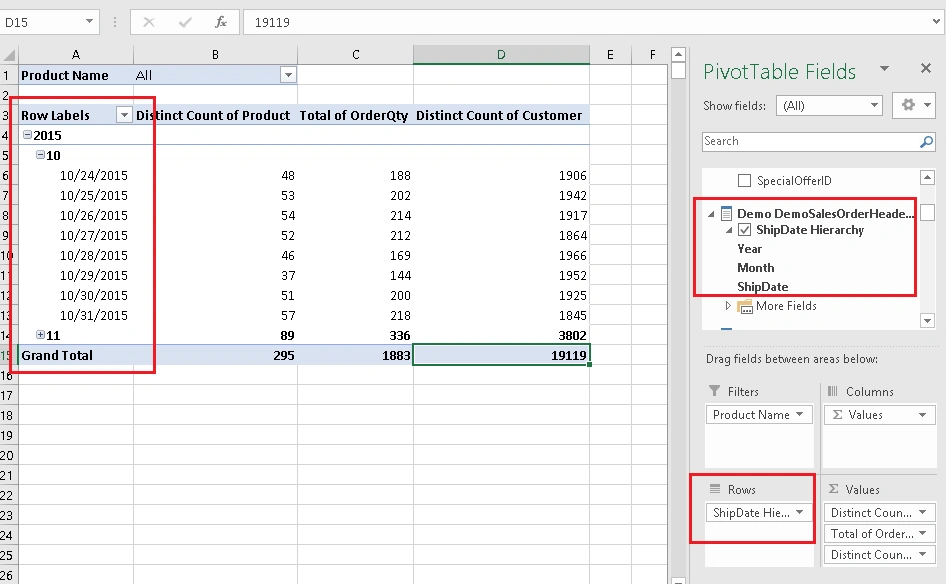
- Go to Ship Date Hierarchy, drag and drop into the row section. This will add Year, Month, and Date Hierarchy in a worksheet.
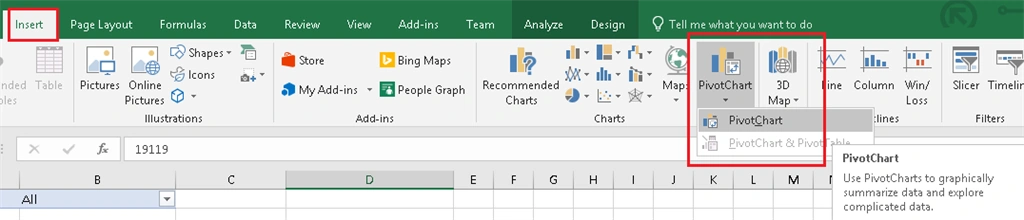
- Now, we are going to a Pivot Chart in the worksheet. Go to Insert Tab. Click on Pivot Chart Button from a ribbon.
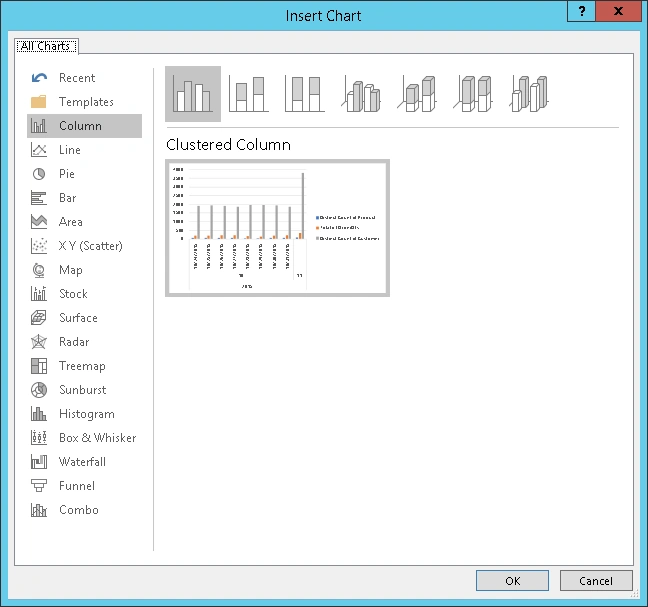
- Here, we will select cluster column chart and click on ok button.
- We can see from the chart as below is created based on data in a worksheet.
Conclusion
This is how we can build SSAS tabular model for business users and business users can utilize the tabular model for data analysis and visualization in Excel.
I hope you will love this article.
Thanks!!!
Join the conversation! Your thoughts help the community grow.