

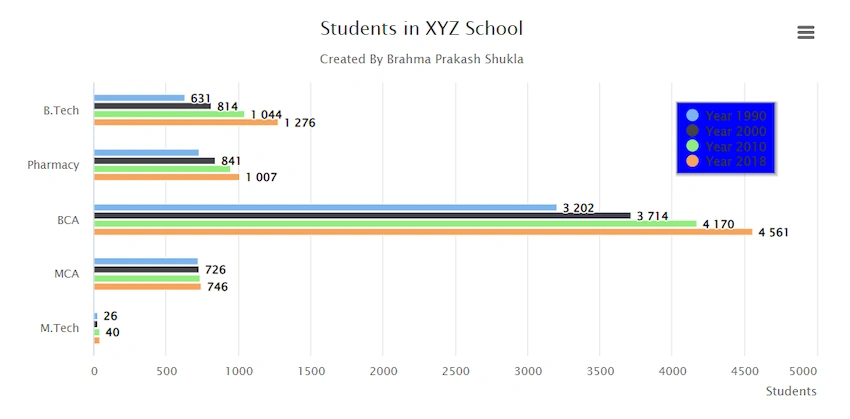
Hello, this article is about how we can create a Bar chart using Highchart in js. It is used to draw area based charts. Bar chart showing horizontal columns. This chart type is often beneficial for smaller screens, as the user can scroll through the data vertically, and axis labels are easy to read.
CDN for using High chart
<script src="https://code.highcharts.com/highcharts.js"></script>
<script src="https://code.highcharts.com/modules/exporting.js"></script>
<script src="https://code.highcharts.com/modules/export-data.js"></script>
<script src="https://code.highcharts.com/modules/accessibility.js"></script>
Create a HTML file i.e, Barchart.html and use below code-
<figure class="highcharts-figure">
    <div id="container"></div>
    <p class="highcharts-Brahmadescription">
       Example of Basic Bar chart.
    </p>
</figure>
Now, create a CSS file for styling of the Bar chart.
.highcharts-figure,
.highcharts-data-table table {
    min-width: 310px;
    max-width: 800px;
    margin: 1em auto;
}

#container {
    height: 400px;
}

.highcharts-data-table table {
    font-family: Verdana, sans-serif;
    border-collapse: collapse;
    border: 1px solid #ebebeb;
    margin: 10px auto;
    text-align: center;
    width: 100%;
    max-width: 500px;
}

.highcharts-data-table caption {
    padding: 1em 0;
    font-size: 1.2em;
    color: blue;
}

.highcharts-data-table th {
    font-weight: 600;
    padding: 0.5em;
}

.highcharts-data-table td,
.highcharts-data-table th,
.highcharts-data-table caption {
    padding: 0.5em;
}

.highcharts-data-table thead tr,
.highcharts-data-table tr:nth-child(even) {
    background: black;
}

.highcharts-data-table tr:hover {
    background: yellow;
}
After that, create a JS file for showing data in Bar chart.
Highcharts.chart('container', {
    chart: {
        type: 'bar'
    },
    title: {
        text: 'Students in XYZ School'
    },
    subtitle: {
        text: 'Created By Brahma Prakash Shukla'
    },
    xAxis: {
        categories: ['B.Tech', 'Pharmacy', 'BCA', 'MCA', 'M.Tech'],
        title: {
            text: null
        }
    },
    yAxis: {
        min: 0,
        title: {
            text: 'Students',
            align: 'high'
        },
        labels: {
            overflow: 'justify'
        }
    },
    tooltip: {
        valueSuffix: ' millions'
    },
    plotOptions: {
        bar: {
            dataLabels: {
                enabled: true
            }
        }
    },
    legend: {
        layout: 'vertical',
        align: 'right',
        verticalAlign: 'top',
        x: -40,
        y: 80,
        floating: true,
        borderWidth: 1,
        backgroundColor:
            Highcharts.defaultOptions.legend.backgroundColor || 'blue',
        shadow: true
    },
    credits: {
        enabled: false
    },
    series: [{
        name: 'Year 1990',
        data: [631, 727, 3202, 721, 26]
    }, {
        name: 'Year 2000',
        data: [814, 841, 3714, 726, 31]
    }, {
        name: 'Year 2010',
        data: [1044, 944, 4170, 735, 40]
    }, {
        name: 'Year 2018',
        data: [1276, 1007, 4561, 746, 42]
    }]
});
Join the conversation! Your thoughts help the community grow.