

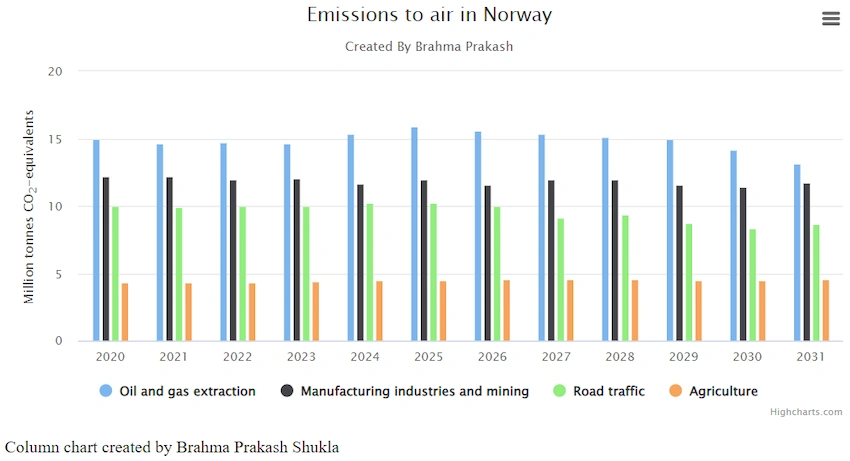
Hello, this article is about how we can create a Column chart using Highcharts in js. It is used to draw column-based charts. A simple bar chart comparing emissions by pollutant. Oil and gas production has the highest overall emissions, followed by manufacturing and mining. The graph highlights the year using the axis crosshairs feature on hover.
CDN for using Area chart
<script src="https://code.highcharts.com/highcharts.js"></script>
<script src="https://code.highcharts.com/modules/exporting.js"></script>
<script src="https://code.highcharts.com/modules/export-data.js"></script>
<script src="https://code.highcharts.com/modules/accessibility.js"></script>
Create a HTML file i.e, ColumnChart.html and use below code.
<figure class="highcharts-figure">
    <div id="container"></div>
    <p class="highcharts-Brahmadescription">
   Column chart created by Brahma Prakash Shukla
    </p>
</figure>
Now, create a CSS file for styling of the Column chart.
.highcharts-figure,
.highcharts-data-table table {
    min-width: 310px;
    max-width: 800px;
    margin: 1em auto;
}

#container {
    height: 400px;
}

.highcharts-data-table table {
    font-family: Verdana, sans-serif;
    border-collapse: collapse;
    border: 1px solid #ebebeb;
    margin: 10px auto;
    text-align: center;
    width: 100%;
    max-width: 500px;
}

.highcharts-data-table caption {
    padding: 1em 0;
    font-size: 1.2em;
    color: #555;
}

.highcharts-data-table th {
    font-weight: 600;
    padding: 0.5em;
}

.highcharts-data-table td,
.highcharts-data-table th,
.highcharts-data-table caption {
    padding: 0.5em;
}

.highcharts-data-table thead tr,
.highcharts-data-table tr:nth-child(even) {
    background: red;
}

.highcharts-data-table tr:hover {
    background: yellow;
}
After that, create a JS file for showing data in Column chart.
Highcharts.chart('container', {
    chart: {
        type: 'column'
    },
    title: {
        text: 'Emissions to air in Norway'
    },
    subtitle: {
        text: 'Created By Brahma Prakash'
    },
    xAxis: {
        categories: [
            '2020',
            '2021',
            '2022',
            '2023',
            '2024',
            '2025',
            '2026',
            '2027',
            '2028',
            '2029',
            '2030',
            '2031'
        ],
        crosshair: true
    },
    yAxis: {
        title: {
            useHTML: true,
            text: 'Million tonnes CO<sub>2</sub>-equivalents'
        }
    },
    tooltip: {
        headerFormat: '<span style="font-size:10px">{point.key}</span><table>',
        pointFormat: '<tr><td style="color:{series.color};padding:0">{series.name}: </td>' +
            '<td style="padding:0"><b>{point.y:.1f}</b></td></tr>',
        footerFormat: '</table>',
        shared: true,
        useHTML: true
    },
    plotOptions: {
        column: {
            pointPadding: 0.2,
            borderWidth: 0
        }
    },
    series: [{
        name: 'Oil and gas extraction',
        data: [14.93, 14.63, 14.73, 14.67, 15.37, 15.89, 15.56,
            15.32, 15.13, 14.93, 14.21, 13.16]

    }, {
        name: 'Manufacturing industries and mining',
        data: [12.24, 12.24, 11.95, 12.02, 11.65, 11.96, 11.59,
            11.94, 11.96, 11.59, 11.42, 11.76]

    }, {
        name: 'Road traffic',
        data: [10.00, 9.93, 9.97, 10.01, 10.23, 10.26, 10.00,
            9.12, 9.36, 8.72, 8.38, 8.69]

    }, {
        name: 'Agriculture',
        data: [4.35, 4.32, 4.34, 4.39, 4.46, 4.52, 4.58, 4.55,
            4.53, 4.51, 4.49, 4.57]

    }]
});
Join the conversation! Your thoughts help the community grow.