

This article will demonstrate how to show loading message or any spinner image when your chart is being loaded or the drill-down chart is being loaded, using Highcharts Library in AngularJS with Web API.
We load messages or images or essential parts when we are working with Asynchronous programming because we don’t know when our data will be ready. So, so far we have to show some message for end users that data is preparing and once the data is ready, we will show the data on UI. So, we are accomplishing the same thing here; if we are using charting in our website and when we load our page then it takes time to get the data from the server and plot it on the chart.
If data is not available then we should display some kind of message that confirms that data is on the way and once data will ready, it will be available on the chart.
This is part third of this series “Highcharts with Angular JS custom directive and Web API”. In the first two parts, we have covered how to create charts in Angular JS and Web API using Highcharts, how to prepare data, how we can get the drill-down functionality and so one.
But this demonstration will cover all the steps which are required to show loading image or message when our chart is loading or we can say data is preparing behind
The whole demonstration is divided into three different parts, as follows.
- Part 1: Create charts using Highcharts Library and AngularJS custom directive with Web API
- Part 2: Implement Drilldown functionality with charts [Nested charts]
- Part 3: Show loading image/message when rendering the charts
So, let’s move to practical implementation of PART 3 and create a loading image for the charts. This demonstration will cover only loading image or message functionality in the chart and we use existing codes which we have created in PART 1 and PART 2. So, to understand it clear just follows up PART 1 and PART 2 also.
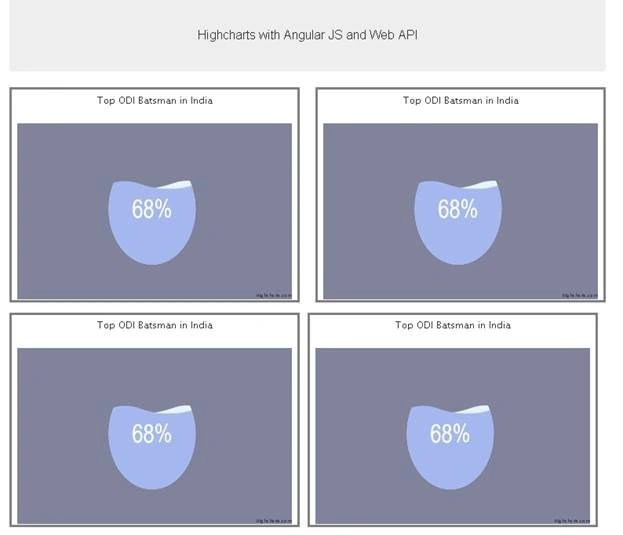
To add message or image in Highcharts, we have a showLoading() and hideLoading() methods available in Highcharts library. Using these functions we can achieve loading and unloading message or image easily.
Let’s see how we can use these methods in the code. So, before binding any data to the series of the chart, we have to call showLoading() method and pass the message or any image path with <img> as a parameter as below.

Ref- https://cdn.codemyui.com/wp-content/uploads/2016/08/Circular-Water-Fill-Loading-Animation.gif
After that you have to check data is available or not, if data is available from API call or some other source then we can bind our data to the series of the charts. Once data is bind to chart, then immediately hide the loading message or image from the screen using the hideLoading() method as below.
- scope.$watch('data', function (newValue) {
- if (newValue != undefined) {
- _.forEach(scope.data, function (item) {
- scope.categories.push(item.Name);
- scope.seriesData.push({ name: item.Name, y: item.TotalRuns, drilldown: item.Name });
- });
- $timeout(function () {
- scope.chartConfig.addSeries({
- name: 'Top ODI Batsman',
- data: scope.seriesData
- });
- scope.chartConfig.hideLoading();
- }, 2000);
- }
- });
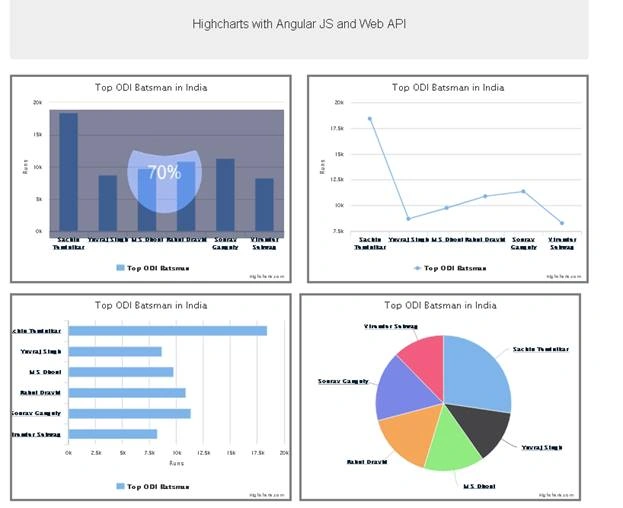
Same we can achieve in Drilldown charts. As we enter in drilldown event, we have to show our image or message using showLoading() method and hide the image or message once data bind with drilldown chart using hideLoading() method. See the below highlighted code.
Join the conversation! Your thoughts help the community grow.