

I have created a GraphChart project using C# (2010), my project has the following six forms:
- frmChart: this is the main form to choose the type of the chart.
- frmGraph1: Binding the Chart to the Array from the DataGrid with the DataBindXY method.
- frmGraph2: Using the DataBindXY method as the previous form but binding the Chart to data from a MDB file and show the following chart:
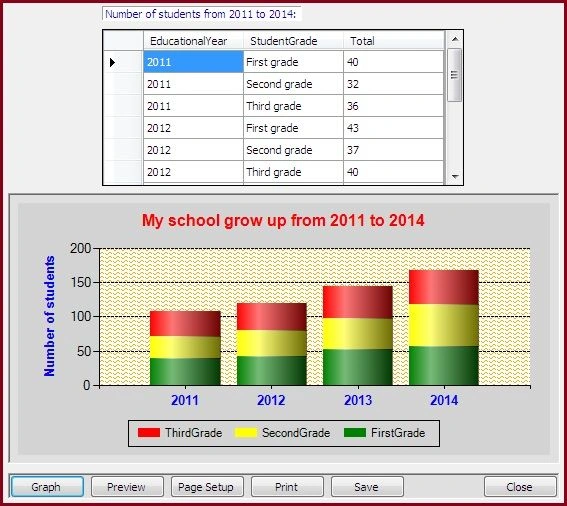
- frmGraph3: Using the DataBindTable method to bind the Chart to the data from a MDB file.
- frmGraph4: Using the AddXY method to bind the Chart to the data from a MDB file.
- frmGraph5: Using DataSource and bind the Chart to the data from a MDB file with the DataBind method.
About the Code
I begin the code in all the forms with the following function:
- private void CreateChartArea()
- {
- //Clear ChartAreas if found:
- MyChart.ChartAreas.Clear();
- //Create new ChartArea
- MyChartArea = new ChartArea();
- //Add ChartArea:
- MyChart.ChartAreas.Add("MyChartArea");
- //Set BackColor to Chart and Graph area:
- MyChart.BackColor = Color.LightGray;
- MyChart.ChartAreas["MyChartArea"].BackSecondaryColor = Color.Orange;
- MyChart.ChartAreas["MyChartArea"].BackHatchStyle = ChartHatchStyle.Wave;
- //Hide vertical lines:
- MyChart.ChartAreas["MyChartArea"].AxisX.MajorGrid.Enabled = false;
- //Set horizontal lines to Dash style:
- MyChart.ChartAreas["MyChartArea"].AxisY.MajorGrid.LineDashStyle = ChartDashStyle.Dash;
- //Set X-Axis to four Series:
- MyChart.ChartAreas["MyChartArea"].AxisX.Maximum = 5;
- //Set X-Axis labels font:
- MyChart.ChartAreas["MyChartArea"].AxisX.LabelStyle.Font = new Font("Arial", 10, FontStyle.Bold);
- //Set X-Axis labels color to blue:
- MyChart.ChartAreas["MyChartArea"].AxisX.LabelStyle.ForeColor = Color.Blue;
- //Set Y-Axis title:
- MyChart.ChartAreas["MyChartArea"].AxisY.Title = "Number of students";
- //Set Y-Axis title font:
- MyChart.ChartAreas["MyChartArea"].AxisY.TitleFont = new Font("Arial", 10, FontStyle.Bold);
- //Set Y-Axis title color:
- MyChart.ChartAreas["MyChartArea"].AxisY.TitleForeColor = Color.Blue;
- //You can use ChartAreas index instead ChartAreas name:
- //Example: MyChart.ChartAreas[0].BackColor = Color.Lavender
- }
Any form has a function to create a "ChartArea", "Series", "Legend" and "Title" of the chart.
The following function creates a ChartArea in the form "frmGraph2":
- private void DrawGraph() //Binding to Data with DataBind methods:
- {
- //Define database query:
- string Family = "Single"; //View Teachers who are single.
- strSql = "SELECT TeacherFamily, TeachingStuff, COUNT(*) AS Total FROM TeacherData " +
- "WHERE TeacherFamily = " + "'" + Family + "'" +
- "GROUP BY TeacherFamily, TeachingStuff " +
- "Order by TeacherFamily";
- //Create database connection:
- OleDbConnection DataCon = new OleDbConnection(strConnection);
- if (DataCon.State == ConnectionState.Open)
- DataCon.Close();
- DataCon.Open();
- //Create database command:
- OleDbCommand myCommand = new OleDbCommand(strSql, DataCon);
- //Set chart data source:
- MyChart.DataSource = myCommand.ExecuteReader();
- //Set series:
- MyChart.Series["TeacherSeries"].XValueMember = "TeachingStuff";
- MyChart.Series["TeacherSeries"].YValueMembers = "Total";
- //Binding to Data:
- MyChart.DataBind();
- myCommand = null;
- //Close connection:
- DataCon.Close();
- }
It is desirable to beautify your data with a chart, so I invite you to go to the source file to read the code because I cannot list all the source code for the limited space available. If you have any idea for this code then please tell me. Thanks for the C# Corner team and thanks for all.
Join the conversation! Your thoughts help the community grow.