

In this article, I have explained how to use Infragistics UI Data Grid (igGrid) in SharePoint online.
Introduction
In most cases, we use jQuery data table for data binding because it’s free of cost with awesome features. Nowadays, several data grids are available in the market for free or at a minimal cost with most enhanced features to play against the data, like Sorting, Paging, Filtering, and exporting to files like PDF, Excel. However, the most important thing is the performance and I am choosing this Infragistics UI data grid because I love its performance of binding the data in a fraction of second when comparing to the jQuery data table.
What Is igGrid?
igGrid is a jQuery grid that binds the data and has the following features.
- Sorting
- Filtering
- Paging
- Grouping
- Column Hiding
- Resizing
- Row and Cell selection
- Summaries
- Tooltips
- Data Editing
Some of the dependencies are required for using the igGrid.
- jquery-1.9.1.js
- ui.core.js
- ui.widget.js
- datasource.js
- ui.widget.js
- ui.shared.js
- templating.js
- util.js
Now, open the SharePoint online data to create a data source for pulling the data from the SharePoint custom list.
For example, we are going to create a Product list to hold the product information, like ProductId, ProductName, Category, Stock etc. I have pushed some dummy data up to 5000 items in SharePoint list.

Open SharePoint Designer -> Site Assets and create Igid.html file into it. Open the HTML file in a text editor to add the following references in the <head></head> Section.
- <!-- Ignite UI Required Combined CSS Files -->
- <link href="https://cdn-na.infragistics.com/igniteui/2017.2/latest/css/themes/infragistics/infragistics.theme.css" rel="stylesheet" />
- <link href="https://cdn-na.infragistics.com/igniteui/2017.2/latest/css/structure/infragistics.css" rel="stylesheet" />
- <script src="https://ajax.aspnetcdn.com/ajax/modernizr/modernizr-2.8.3.js"></script>
- <script src="https://code.jquery.com/jquery-1.11.3.min.js"></script>
- <script src="https://code.jquery.com/ui/1.11.1/jquery-ui.min.js"></script>
- <!-- Ignite UI Required Combined JavaScript Files -->
- <script src="https://cdn-na.infragistics.com/igniteui/2017.2/latest/js/infragistics.core.js"></script>
- <script src="https://cdn-na.infragistics.com/igniteui/2017.2/latest/js/infragistics.lob.js"></script>
Create an AJAX request to fetch the data from SharePoint list. Add the HTML into the <body></body> tag.
- <table id="grid"></table>
Declare the necessary variables.
- <script>
- $(function() {
- var datas;
- var results = [];
- $.ajax({
- url: _spPageContextInfo.webAbsoluteUrl + "/_api/web/lists/getbytitle('accessoriesdata')/items?$top=5000",
- method: "GET",
- headers: {
- "Accept": "application/json; odata=verbose"
- },
- success: function(data) {
- datas = data.d.results;
- console.log(datas);
- },
- error: function(error) {
- console.log(JSON.stringify(error));
- }
- });
- });
- </script>
In the browser console, you are now able to see how many records we retrieved in that AJAX Call.

I have just formatted a data source like this.
- var result = [
- { "ProductID": 1, "ProductName": "Adjustable Race", "Category": "AR-5381", “Stock”:”” }
- ]
Code
- results.push({ "ProductID": datas[i].ID,
- "ProductName": datas[i].ProductName,
- "Category":datas[i].Category,
- "Stock":datas[i].Stock
- });
- console.log(results);
Result

Now, in the next step, go and initialize the igGrid function of the table.
- function initigGrid(value){
- //Initialize the grid
- $("#grid").igGrid({
- autoGenerateColumns: false,
- //Define the columns and it’s datatypes
- columns: [
- { headerText: "Product ID", key: "ProductID", dataType: "number" },
- { headerText: "Product Name", key: "ProductName", dataType: "string" },
- { headerText: "Category", key: "Category", dataType: "string" },
- { headerText: "Stock", key: "Stock", dataType: "number" }
- ],
- //Pick the datasource to display
- dataSource: value
- });
- }
The overall script looks like below.
- <script>
- $(function() {
- var datas;
- var results = [];
- $.ajax({
- url: _spPageContextInfo.webAbsoluteUrl + "/_api/web/lists/getbytitle('accessoriesdata')/items?$top=5000",
- method: "GET",
- headers: {
- "Accept": "application/json; odata=verbose"
- },
- success: function(data) {
- datas = data.d.results;
- console.log(datas);
- // Iterate through the data
- for(i=0; i < datas.length; i++)
- {
- results.push({ "ProductID": datas[i].ProductID,
- "ProductName": datas[i].Title,
- "Category":datas[i].Category,
- "Stock":datas[i].Stock
- });
- }
- console.log(results);
- initigGrid(results); //Call the function after successful results
- },
- error: function(error) {
- console.log(JSON.stringify(error));
- }
- });
- });
- function initigGrid(value){
- $("#grid").igGrid({
- autoGenerateColumns: false,
- columns: [
- { headerText: "Product ID", key: "ProductID", dataType: "number" },
- { headerText: "Product Name", key: "ProductName", dataType: "string" },
- { headerText: "Category", key: "Category", dataType: "string" },
- { headerText: "Stock", key: "Stock", dataType: "number" }
- ],
- dataSource: value
- });
- }
- </script>
Result
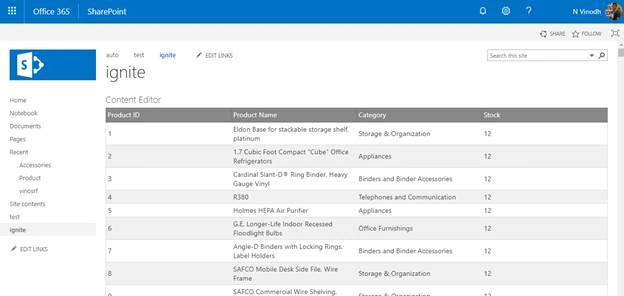
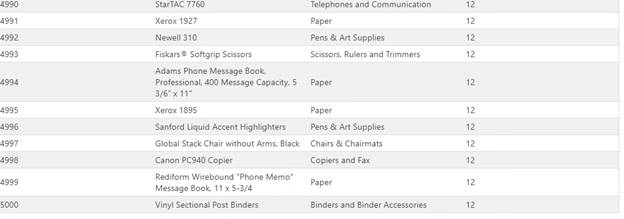
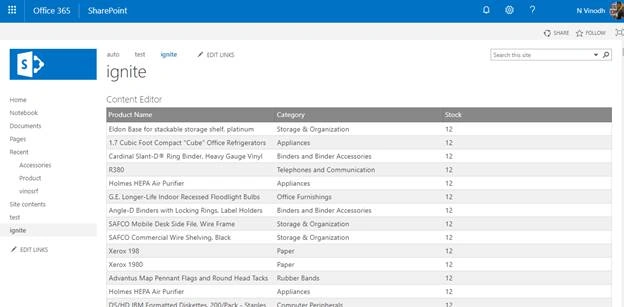
It’s showing 5000 items from the SharePoint list without paging. Now, I am going to show how to hide the column “ProductID”.
Just set the hidden attribute to true inside the column object. You can also format the width and height of the column.
- columns: [
- { headerText: "Product ID", key: "ProductID", dataType: "number" , hidden: true }
- ]
Paging
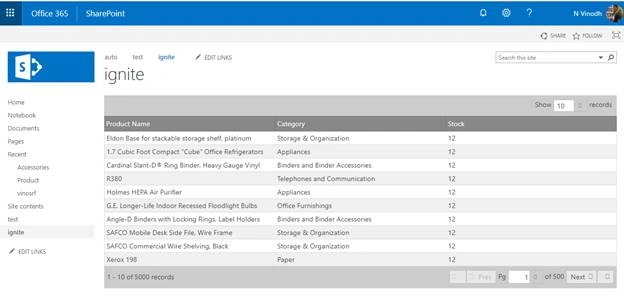
Paging allows you to show the number of items per page. You can navigate to next and previous to next items.
Code
Features
- {
- name: "Paging", // It defines the paging feature
- pageSize: 10 // Mention the page size it view 10 per page now
- }
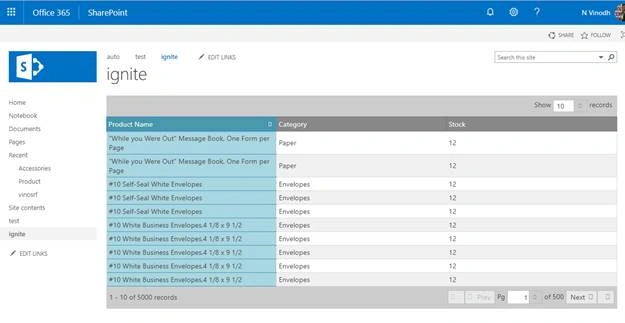
Sorting
This feature allows you to sort the data in the columns. It also supports single and multi-column sorting.
- features: [
- {
- name: "Sorting", // Define sorting feature
- type: "local" // Type of sorting example local, remote
- }
- ]
Filter
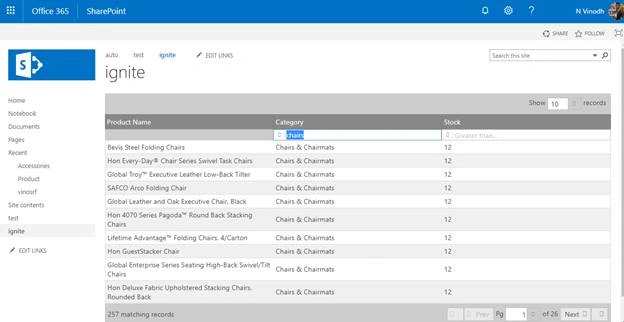
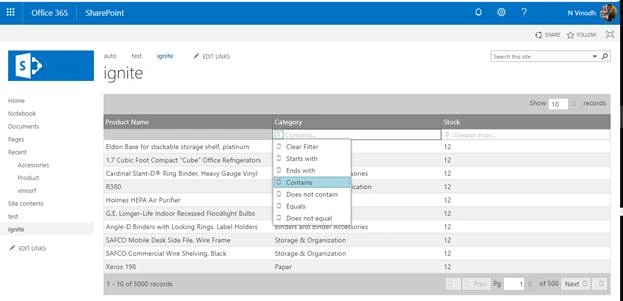
It helps to filter the data based on the conditions; for example - Equals, Not equals, contains etc.
Code
- {
- name: "Filtering", // Define filter feature
- type: "local", // Type of filter
- columnSettings: [
- {
- // If you do not want to filter some column, just set allowFiltering: false
- // By default, other columns are set to true.
- columnKey: "ProductName",
- allowFiltering: false
- },
- {
- columnKey: "Stock",
- condition: "greaterThan" // Also set the default condition
- }
- ]
- }
GroupBy
This feature helps in grouping the products. You can easily understand the value of the particular set of products.
Code
- name: "GroupBy",
- /By default set the groupby value of particular column
- columnSettings: [
- {
- columnKey: "ProductName",
- isGroupBy: true
- }
- ]
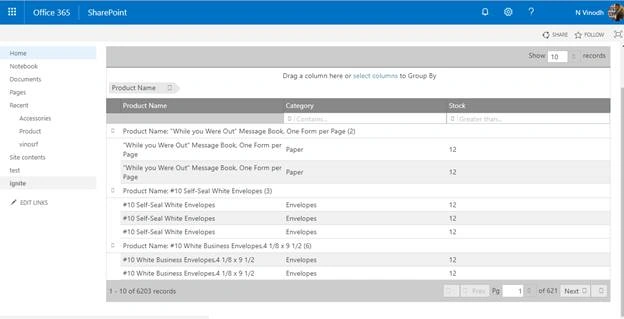
Just drag and drop the columns to the Groupby section for grouping the data.
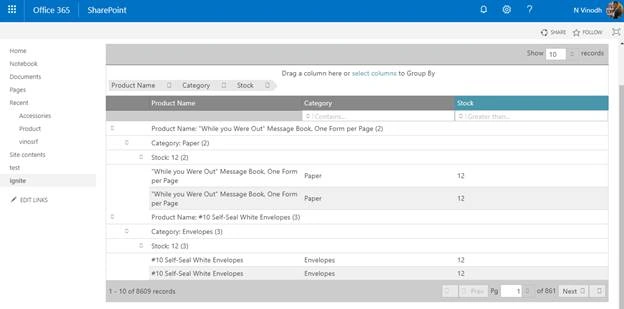
Finally, the code looks like below
Code
- <!DOCTYPE html PUBLIC "-//W3C//DTD XHTML 1.0 Strict//EN" "http://www.w3.org/TR/xhtml1/DTD/xhtml1-strict.dtd">
- <html xmlns="http://www.w3.org/1999/xhtml">
- <head>
- <script src="https://ajax.aspnetcdn.com/ajax/modernizr/modernizr-2.8.3.js"></script>
- <script src="https://code.jquery.com/jquery-1.11.3.min.js"></script>
- <script src="https://code.jquery.com/ui/1.11.1/jquery-ui.min.js"></script>
- <!-- Ignite UI Required Combined JavaScript Files -->
- <script src="https://cdn-na.infragistics.com/igniteui/2017.2/latest/js/infragistics.core.js"></script>
- <script src="https://cdn-na.infragistics.com/igniteui/2017.2/latest/js/infragistics.lob.js"></script>
- <!-- Ignite UI Required Combined CSS Files -->
- <link href="https://cdn-na.infragistics.com/igniteui/2017.2/latest/css/themes/infragistics/infragistics.theme.css" rel="stylesheet" />
- <link href="https://cdn-na.infragistics.com/igniteui/2017.2/latest/css/structure/infragistics.css" rel="stylesheet" />
- </head>
- <body>
- <table id="grid"></table>
- <script>
- $(function() {
- var datas;
- var results = [];
- $.ajax({
- url: _spPageContextInfo.webAbsoluteUrl + "/_api/web/lists/getbytitle('accessoriesdata')/items?$top=5000",
- method: "GET",
- headers: {
- "Accept": "application/json; odata=verbose"
- },
- success: function(data) {
- datas = data.d.results;
- console.log(datas);
- for (i = 0; i < datas.length; i++) {
- results.push({
- "ProductID": datas[i].ProductID,
- "ProductName": datas[i].Title,
- "Category": datas[i].Category,
- "Stock": datas[i].Stock
- });
- }
- console.log(results);
- initigGrid(results)
- },
- error: function(error) {
- console.log(JSON.stringify(error));
- }
- });
- });
- function initigGrid(value) {
- $("#grid").igGrid({
- autoGenerateColumns: false,
- primaryKey: "ProductID",
- caption : "<span> <img src='https://sharepointtechie.sharepoint.com/sites/auto/SiteAssets/sp.png' alt='sharepoint' height='50px'></span>",
- width: '100%',
- columns: [{
- headerText: "Product ID",
- key: "ProductID",
- dataType: "number",
- hidden: true
- },
- {
- headerText: "Product Name",
- key: "ProductName",
- dataType: "string"
- },
- {
- headerText: "Category",
- key: "Category",
- dataType: "string"
- },
- {
- headerText: "Stock",
- key: "Stock",
- dataType: "number"
- }
- ],
- dataSource: value,
- features: [{
- name: "Paging",
- pageSize: 10
- },
- {
- name: "Sorting",
- type: "local"
- },
- {
- name: "Filtering",
- type: "local",
- columnSettings: [{
- columnKey: "ProductName",
- allowFiltering: false
- },
- {
- columnKey: "Stock",
- condition: "greaterThan"
- }
- ]
- },
- {
- name: "Resizing"
- },
- {
- name: "GroupBy",
- columnSettings: [{
- columnKey: "ProductName",
- isGroupBy: true
- }]
- },
- ]
- });
- }
- </script>
- </body>
- </html>
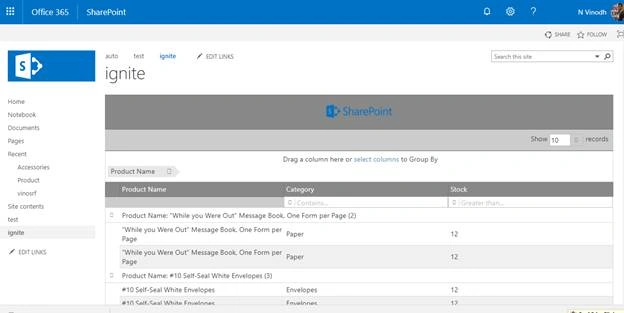
Get connected to learn more features of the Infragistics data grid in my upcoming articles.
Happy SharePointing!!!
Mark ApplePosted Apr 15, 2018, 7:31 PM
This is very cool. Thank you for the detailed write up. Is it possible to add an Edit item button? Also how can you combine two identical lists to populate on igGrid? Thanks!